Download

1 / 40
400 likes | 475 Views
The Governments role in Promoting healthy eating . What you need to know. KEY KNOWLEDGE : ‘ The role of Australia’s governments in promoting healthy eating through: the information provided by nutrition surveys and how it is used

E N D
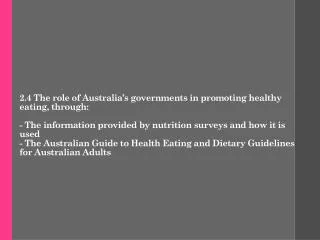
What you need to know • KEY KNOWLEDGE: • ‘The role of Australia’s governments in promoting healthy eating through: • the information provided by nutrition surveys and how it is used • The purpose of Nutrient Reference Values to guide dietary intake • The Australian Guide to Healthy Eating and Dietary Guidelines • Legislation developed by Food Standards Australia and New Zealand governing the safety and quality of food’ • KEY SKILLS: ‘ • Explain and draw informed conclusions about the role of government and non-government agencies in promoting healthy eating
The role of governments in promoting healthy eating • The federal government has established a number of initiatives, besides Medicare and the PBS, in order to improve the health of the population. • Nutrition is an area that requires attention if the level of Australia’s health is to improve. • In Australia, undernutrition and nutritional deficiencies are rare, with cases generally limited to specific population groups (EG: the aged, those with a chronic disease or disability, some Aboriginal and Torres Strait Islander communities and those suffering from substance or alcohol abuse.
The role of governments in promoting healthy eating • It’s OVER consumption – the consumption of more kj’s than is required to meet energy needs – that is the key dietary issue affecting Australians, impacting on their health and risk of disease. • Obesity increases the risk of many chronic conditions including CVD, type 2 diabetes and particular cancers including breast and bowel.
The role of governments in promoting healthy eating • Some examples of these government initiatives are listed below:
What do you think Nutrition Surveys entail? • What do you think they look at? • Why do you think they do them? Nutrition Surveys
What do you think Nutrition Surveys entail? • What do you think they look at? • Provide a snap shot of what Australians (or population groups in Australia) are eating • Why do you think they do them? • They use this information to guide policy and funding in order to combat certain issues (i.e. obesity and fruit and veg consumption) Nutrition Surveys
Surveys • Nutrition surveys provide a snapshot of what Australians (or population groups within Australia) are eating. • This information can then be used to guide policy and funding in order to combat issues such as obesity and inadequate fruit and vegetable intake. • Examples of ‘Nutritional Surveys’ conducted in Australia include: • National Nutritional Survey – 1995 • National Children’s Nutrition and Physical Activity Survey – 2007 • Food consumption survey • Kids eat, Kids play survey
National Nutritional Survey (NNS) - 1995 • Data was collected about food and beverage consumption over a 24hr period, eating habits, dietary patterns and physical measurements. • From this data, nutrient intake could be established to gauge whether Australians were getting enough key nutrients and identify key areas where population groups were deficient. • Data collected from this survey provides a benchmark for future data collection to gain a better understanding of the health and nutritional status of Australians over time.
National Nutritional Survey (NNS) - 1995 • The objectives of the 1995 National Nutrition Survey are listed below. These also give an outline as to some of the ‘uses’ of nutritional surveys.
National Children’s Nutrition and Physical Activity Survey - 2007 • This first survey for children was conducted by the CSIRO and the University of South Australia and was jointly funded by government (federal) and industry (Australian Food and Grocery Council). • The objectives of the survey were to: • Assess the reported food and nutrient intake, • Physical activity levels and • Body measurements (height, weight, waist circumference) of a sample of children (a total over 4,400) aged 2 – 16 years (physical activity data was collected from children aged 5-16 years), randomly selected from across Australia. (Source: National Children’s Nutrition and Physical Activity Survey 2007 – Key Findings. www.health.gov.au/)
(Source: National Children’s Nutrition and Physical Activity Survey 2007 – Key Findings. www.health.gov.au/) Data Analysis: Q1: Identify areas that are cause for concern from the ‘key findings’ stated. Q2: Suggest 1 action that could be taken by government or the private sector to address the findings stated.
(Source: National Children’s Nutrition and Physical Activity Survey 2007 – Key Findings. www.health.gov.au/) Data Analysis: Q3: Identify 2 trends in the data supplied for ‘nutrition’. Q4: Suggest 1 action that the government or the private sector could take to address the ‘nutrition’ findings stated.
(Source: National Children’s Nutrition and Physical Activity Survey 2007 – Key Findings. www.health.gov.au/) Data Analysis: Q5: What might be some of the long term consequences if nothing is done about the findings stated from this survey? Q6: Outline some of the ‘benefits’ to the government and private sector by completing this survey.
National Children’s Nutrition and Physical Activity Survey - 2007 • There are many benefits for both government and industry that can result from this survey. The survey was completed to: • Compare the nutrition information to the data collected in the 1995 National Nutrition Survey to see what trends were emerging • Compare the data on physical activity to the Australian Physical Activity Guidelines that were introduced in 2005 to see how many children are meeting the suggested requirements • Provide important information to governments, health professionals and the food and beverage industry to understand changes in children’s eating and exercise habits
National Children’s Nutrition and Physical Activity Survey - 2007 • There are many benefits for both government and industry that can result from this survey. The survey was completed to (continued): • Provide information that can be used by all sectors to work together to address a number of health concerns in children, such as growing rates of obesity • Monitor the performance of a number of health strategies • Allow the Australian Government to develop policies based on the results • Allow the food industry to respond to the changing needs of children.
http://www.gofor2and5.com.au/HealthEating/HowamIdoing/tabid/87/Default.aspxhttp://www.gofor2and5.com.au/HealthEating/HowamIdoing/tabid/87/Default.aspx
Nutrition Surveys • Limitations of nutrition surveys • Can have limited use unless combined with other data relating to health issues • Often the data relates to only a 24 hour period; it is not reflective of overall food consumption • Inaccuracies can easily occur through people not reporting information accurately • Don’t take place frequently enough
Nutrient Reference Values (NRV) Recent food labeling laws ensure that consumers are provided with a lot more information when it comes to nutrient amounts mentioned on packaging. However, this information is meaningless if we do not know how much we should be consuming each day. This is where the Nutrient Reference Values come in. They help to provide a ‘point of reference’ that enables both groups and individuals to assess the nutritional adequacy of their food intake.
Nutrient Reference Values (NRV) So what was used before the Nutrient Reference Values (NRV’s) were introduced by the National Health and Medical Research Council (NHMRC) in 2005? The Recommended Dietary Intake (RDI) values were developed for a range of nutrients in 1991. These values gave the daily amount of certain nutrients required to meet the nutritional needs of a majority (97-98%) of a population group based on age and gender.
Nutrient Reference Values (NRV) So what were some of the issues with using RDI’s? Although useful, the RDI’s were established for groups rather than individual assessment and were often misused when trying to determine whether an individual’s diet was adequate or not. To overcome the issues associated with RDI’s, the government developed a range of values for each nutrient that could be used to assess the nutritional adequacy of food intake for both groups and individuals. The values are called NUTRIENT REFERENCE VALUES (NRV’s)
Nutrient Reference Values (NRV) • The NRV’s are four different values for each nutrient replacing the single RDI value. The four values give a ‘range’ for the amount of each nutrient that should be consumed by the general healthy population. • This provides a more comprehensive guide and enables a more accurate assessment of dietary needs.
Nutrient Reference Values (NRV) • The four different values include: • EAR(Estimated Average Requirement) – A daily nutrient level estimated to meet the requirements of half the healthy individuals in a particular life stage and gender group. • RDI (Recommended Dietary Intake) – The average daily intake level that is sufficient to meet the nutrient requirements of nearly all (97-98%) healthy individuals in a particular life stage and gender group. • AI (Adequate Intake) – Used when RDI cannot be determined, it is the average daily nutrient intake level based on observed or experimentally determined approximations. • UL (Upper Limit) – The highest average daily nutrient intake level likely to pose no adverse health effects to almost all individuals in the general population. (Source: adapted from NHMRC, 2005) Ref to pg 244 text for the case study. Complete Q. 1 & 2.
Who uses the NRVs? • Government • Health Professionals • Doctors • Dietitians Nutrient Reference Values The NRVs can be quite confusing for people without a detailed knowledge of food and nutrition and are therefore not intended to be used by consumers themselves.
How are the NRVs used? • Health professionals use them to: • Dieticians and Doctors – assess nutrition intake of individuals to develop food menus • Nutrition Australia and the Heart Foundation – assist in development of food selection models and policies • Food Industry – to develop and assess new products Nutrient Reference Values
Government Sectors use them to develop: • The Australian Guide to Healthy Eating • This food selection model is a practical interpretation of the Core Food Group Analysis and can be used by consumers as a guide for adequate nutrition intake. • The Dietary Guidelines for Australians • This provides general advice about the dietary practices that can promote optimal health and wellbeing in individuals and the community. • Legislation relating to mandatory fortification of foods • Surveys and medical data are compared with the NRVs to assess nutritional deficiencies in the population. If nutrients are found to be deficient, the government can legislate to make fortification of certain foods compulsory – what is added to bread? What is added to water? Nutrient Reference Values
Nutrient Reference Values (NRV) • So, what is the PURPOSE of the NRV’s? • As the NRV’s can be confusing for people without detailed knowledge of food and nutrition, they are NOT intended to be applied by CONSUMERS themselves. • INSTEAD, the NRV’s are there to be used by PROFESSIONALS, such as • Dieticians and doctors to assess the likelihood of inadequate intake in individuals or groups of people • University and nutrition researchers to analyse the nutritional content of particular food items and to assist in the development of knowledge regarding nutrition • Industrial caterers for meal planning or large scale catering in places such as hospitals, the armed services and nursing homes • The food industry in developing and assessing new food products
Nutrient Reference Values (NRV) ⏎ The NRV’s are there to be used by PROFESSIONALS, such as (cont): • The government sector in setting food policy and legislation, such as the development of food selection guides or food labelling to help the public make informed choices. The NRV’s guide the nutrition information released by governments and non-government organisations. They are used to formulate consumer guides such as the Australian Dietary Guidelines and the Australian Guide to Healthy Eating
The Australian dietary guidelines • Developed by the national health and medical research council (fed Gov.) • General guidelines to help consumers and industry develop healthy eating habits • Two sets of guidelines • Adults • Children and Adolescents
The Australian dietary guidelines of Australian Adults • The guidelines recommend that Australian adults enjoy a wide variety of nutritious foods: • List the recommendations from your handouts
The Australian dietary guidelines for Australian children and adolescents • Children and adolescents need sufficient nutritious foods to grow and develop normally • List the recommendations from your handout
The Australian guide to healthy eating • Food Selection model • Different from the ADG because it shows the approximate proportions of foods that should be consumed from the five food groups (more specific) • Works side by side with the ADG • Encourages people to eat from the 5 ‘core food groups’ • Bread, cereals, rice, pasta, noodles • Vegetables, legumes • Fruit • Milk, yogurt , cheese • Meat, fish, poultry, eggs, nuts, legumes • Also includes • Drink plenty of water • Sometimes foods (high fat / salt / sugar
The Australian guide to healthy eating • In addition to the visual guide there are some recommendations to increase the chance of users eating a balanced diet • Eat enough foods from each of the five food groups every day • Choose different varieties of foods from within each of the five food groups from day to day, week to week, and through different times of the year • Eat plenty of plant foods (breads, cereals, rice, pasta, noodles, vegetables, and fruit) Eat moderate amounts of animal foods (milk, yoghurt, cheese, meat, fish, poultry, eggs) Eat small amounts of extra foods, margarines and oils • Drink plenty of water
Food safety, quality and legislation • Food Standards Australia and New Zealand (FSANZ) • We are a bi-national Government agency. Our main responsibility is to develop and administer the Australia New Zealand Food Standards Code (the Code), which lists requirements for foods such as additives, food safety, labelling and GM foods. Enforcement and interpretation of the Code is the responsibility of State/Territory departments and food agencies within Australia and New Zealand.
Food Standards Australia and New Zealand • Code of FSANZ • General Food standards • Labelling • Nutrient health claims • Food product standards • Food safety standards • Primary production standards • Overall goal is to ensure a safe food supply and well-informed consumers. • Works in conjunction with federal government and state/ local governments
Food Labelling • A label must tell the truth and not be misleading it must contain 5 key components • Nutritional Information Panel • Date Marking • Name and description of the food • Directions for use and storage • Legibility requirements • In your workbooks summarise the information on each component from your textbook and provide specific examples. Pg 252
Nutrient and health Claims • FSANZ is currently working on an updated health claims standard . • The current standard consists of three types of claims: • nutrition content claims — statements about the presence or absence of a nutrient, energy or a biologically active substance in the food. • general level health claims — claims about the effect of a nutrient or substance in a food on a health function or a non-serious disease. • high level health claims — claims about the effect of a nutrient or substance in a food, that make reference to a serious disease or biomarker of a serious disease ( biomarkers of serious disease include blood cholesterol and blood pressure).
FSANZ • Complete summaries of the other three key components of the FSANZ code