Download
1 / 20

E N D
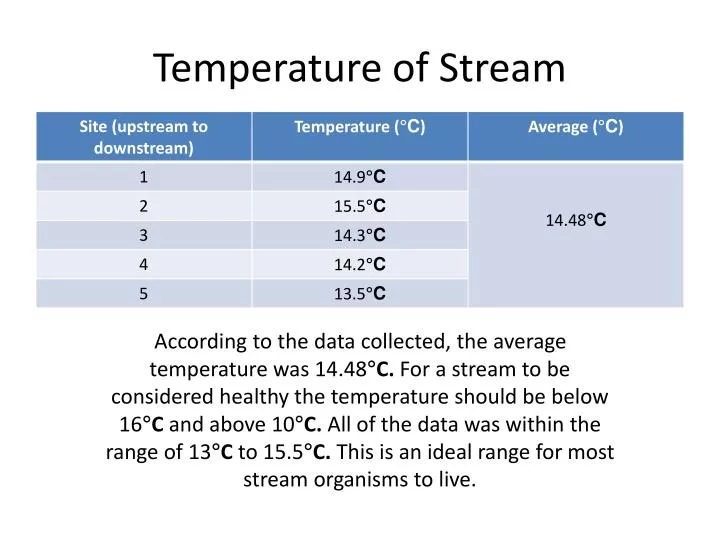
Temperature of Stream According to the data collected, the average temperature was 14.48°C. For a stream to be considered healthy the temperature should be below 16°C and above 10°C. All of the data was within the range of 13°C to 15.5°C. This is an ideal range for most stream organisms to live.
Dissolved Oxygen of Stream The data that we collected showed that the dissolved oxygen was 4ppm at a temperature of 14°C . This then equates to a saturation of 39%. On a scale of 0ppm to 11ppm, zero meaning there is not enough oxygen to sustain wildlife, and eleven meaning the best conditions for wildlife, 4ppm is considered mid-range quality allowing for certain types of stream organisms to survive.
Dissolved Oxygen *Levels of 4-5 mg/L are needed to support a wide variety.
Nitrates • Trial 1: <5ppm • The healthy range of nitrates is 5ppm or lower • This indicates that the stream has a healthy level of nitrates
Vertebrates • We collected 4 fish samples, 3 were bluegill, and 1 was a green sunfish • All these fish are moderately tolerant of pollution • This indicates that the stream is at most moderately pollutant, but could also be non polluted
Copper, Nitrate, Chlorine, Iron, and Conductivity Healthy Ranges: Copper: 1-10 ppb Nitrate: 5 or less ppm Chlorine: 0.01 or less ppm Iron: 0.3 or less ppm Conductivity: 150-500 μS/cm Based on our results, the stream has healthy levels of nitrates, iron, copper, and chlorine, but has an unhealthy level of conductivity.
FLOW CYCLE Overall the flow cycle was poor in all areas. Not only was it slow, but it showed little difference in different depths. In a healthy stream, the water would move slower in deeper areas and faster in shallow areas as shown here only with a larger difference.
Plant Species Variation The plant species was healthy due to the fact that eight different species of plants can be found consistently along the stream. However the species were mainly grasses and weeds. This shows that even though the stream is a hospitable environment, capable of supporting vegetation, only adaptive species can thrive here.
Presence of bacteria in stream We were unable to test for coliform bacteria, but we did find a substantial amount of bacteria in our cultures. 200 or more colonies per 100 mL of water is considered unhealthy. We found over 100 colonies per 5 mL of water.
pH Level of Stream The average pH level for our three samples is 8.2, which is slightly above the healthy range for water.
pH • The pH was measured using a pH meter. There were 4 levels of the independent variable (distance in meters) and 5 trials for each level. The average of the trials for each IV are shown below. • The average range was between 8.5-8.9. • The healthy pH for a stream is 8. • Based on the data, the stream is fairly healthy. The data is between .5-.9 pH away from the healthy stream pH of 8.
Conductivity • Conductivity was measured using a Vernier conductivity meter. • There were four levels of the independent variable (distance in meters) and 5 trials for each level. The trials were averaged for each IV and are shown below. • The data ranged from 278.85-290.45 microsiemens. • The healthy range is 150-500 microsiemens. • Based on the data, the stream is within the healthy range and it can therefore be • Concluded that conductivity of the stream is normal.
Macroinvertebrates Overall, the variety of species found in the stream indicates that the stream is relatively healthy because it contains species that are very intolerant to pollution.
pH and Alkalinity The pH in our stream is a little too basic for ideal levels, which are 7-8. The alkalinity is also too high, as ideal alkalinity levels are 20-200 ppm (parts per million).
Healthy Ranges Turbidity: <5 NTU Alkalinity: 100-200 mg/L Hardness: 4.1 G/D pH: 6.0 – 8.0 pH Due to exceptionally high hardness and high turbidity from this data it can be supported that the stream is UNHEALTHY
Dissolved Oxygen Levels All of the results fit within the ideal range for Dissolved Oxygen Saturation (60-100%). 1 of the results fit in the ideal range (90-100%). There is a correlation between the samples’ respective locations on the stream relative to each other an dissolved Oxygen Saturation. As the samples were taken further upstream, the Dissolved Oxygen level tended to lower.
Nitrate Levels Samples were taken from the same cross section (CS) but from different current speeds – mid cross section (M-CS) had relatively faster currents while the edge of the cross section had almost no current. Nitrate values were obtained via nitrate test strip; every strip indicated either no pink coloring or a very faint pink color,, which means very little amounts of nitrate. All of the results fall within the ideal range of Nitrate levels- most unpolluted streams contain < 1ppm of nitrate, whereas high pollution results in high levels, around 20 ppm.
Turbidity Stick (in) TSS (mg/L) Quality of water Trial 1 7.4 50.09 Impaired Trial 2 8.2 43.75 Impaired Trial 3 8.7 40.46 Impaired Trial 4 6.5 59.44 Impaired Trial 5 6.4 60.67 Impaired Average 7.44 50.88 Impaired Values were obtained using a tube, and samples were taken from different areas, upstream / downstream. None of the values fell within the ideal range of suspended solids, measured in mg/L TSS < 10 mg/lexcellent water quality 10mg/l < TSS < 28mg/L normal water quality 29mg/l < TSS < 133mg/l impaired water stream TSS > 133mg/l severely impacted stream
Topic 4 Results Testing Free and Total Chlorine of a Stream • By using chlorine strips we were able to measure the amount of free and total chlorine • A healthy amount of free chlorine in nay natural water source is 0.0-1.0 PPM • A healthy amount of total chlorine in any natural water source is 0.0 PPM • In the stream the highest amount of free chlorine was healthy, and the total Chlorine also
Topic 4 Results Testing Fecal Coliform • Fecal Coliform is the amount of fecal bacteria in the stream. • A healthy amount of fecal bacteria is between 20-60 colonies. • The Stream had over 100 colonies in a 5 mL sample, suggesting an unhealthy stream.