Download
1 / 42
470 likes | 671 Views
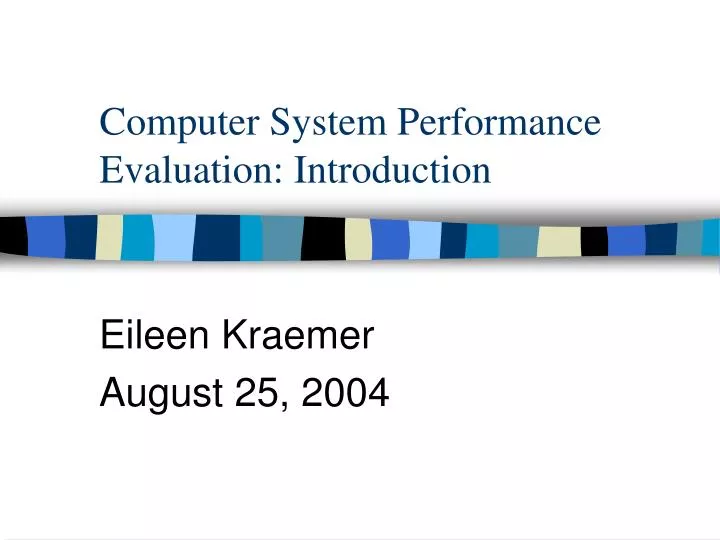
Computer System Performance Evaluation: Introduction. Eileen Kraemer August 25, 2004. Evaluation Metrics. What are the measures of interest? Time to complete task Per workload type (RT /TP/ IC/batch) Ability to deal with failures Catastrophic / benign Effective use of system resources.

E N D
Computer System Performance Evaluation: Introduction Eileen Kraemer August 25, 2004
Evaluation Metrics • What are the measures of interest? • Time to complete task • Per workload type (RT /TP/ IC/batch) • Ability to deal with failures • Catastrophic / benign • Effective use of system resources
Performance Measures • Responsiveness • Usage level • Missionability • Dependability • Productivity
Classification of Computer Systems • General purpose • High availability • Real-time control • Mission-oriented • Long-life
Techniques in Performance Evaluation • Measurement • Simulation Modeling • Analytic Modeling • Hybrid Modeling
Applications of Performance Evaluation • System Design • System Selection • System Upgrade • System Tuning • System Analysis
Workload Characterization • Inputs to evaluation: • Under admin control: • Scheduling discipline, device connections, resource allocation policies …. • Environmental inputs: • Inter-event times, service demands, failures • = workload • Drives the real system (measurement) • Input to simulation • Basis of distribution for analytic modeling
Workload characterization • How much detail? How to represent? • Analytical modeling: • statistical properties • Simulation: • Event trace, either recorded or generated according to some statistical properties
Benchmarking • Benchmarks are sets of well-known programs • Vendors run these programs and report results (some problems with this process)
Metrics used (in absence of benchmarks).. • Processing rate: • MIPS (million instructions per second) • MFLOPS (million f.p. ops per second) • Not particularly useful • different instructions can take different amounts of time • Instructions and complexity of instructions differ from machine to machine, as will the # of instructions required to execute a particular program
Benchmarks: • Provide opportunity to compare running times of programs written in a HLL • Characterize an application domain • Consist of a set of “typical” programs • Some application benchmarks (real programs), others are synthetic benchmarks
Synthetic benchmarks • Programs designed to mimic real programs by matching their statistical properties • Fraction of statements of each type (=, if, for) • Fraction of variables of each type (int v real v char) (local v global) • Fraction of expressions with certain number and type of operators, operands
Synthetic Benchmarks • Pro: • Can model a domain of application programs in a single program
Synthetic Benchmarks • Con: • If expressions for conditionals are chosen randomly, then code sections may be unreachable and eliminated by a “smart” compiler • Locality-of-reference seen in normal programs may be violated => resource allocation algorithms that rely on locality-of-reference affected • May be small enough to fit in cache => unusually good performance, not representative of domain the benchmark is designed to represent
Well-known benchmarks for measuring CPU performance • Whetsone – “old” • Dhrystone – improved on Whetstone • Linpack • Newer: • Spice, gcc, li, nasa7, livermore • See: http://www.netlib.org/benchmark/ • Java benchmarks: • See http://www-2.cs.cmu.edu/~jch/java/resources.html
Whetstone (1972) • Synthetic • Models Fortran, heavy on f.p. ops • Outdated, arbitrary instruction mixes • Not useful with optimizing or parallelizing compilers • Results in mega-whetstones/sec
Dhrystone (1984) • Synthetic, C (originally Ada) • Models progs with mostly integer arithmetic and string manipulation • Only 100 HLL statements – fits in cache • Calls only strcpy(), strcmp() – if compiler inlines these, then not representative of real programs • Results stated in “Dhrystones / second”
Linpack • Solves a dense 100 x 100 linear system of equations using the Linpack library package • A(x) = B(x) + C*D(x) • .. 80% of time • Still too small to really test out hw
“Newer” • Spice • Mostly Fortran, int and fp arith, analog circuit simulation • gcc • Gnu C compiler • Li • Lisp interpreter, written in C • Nasa7 • Fortran, 7 kernels using double-precision arithmetic
How to compare machines? B A C E D
How to compare machines? A B VAX 11/780 C Typical 1 MIPS machine D E
To calculate MIPS rating • Choose a benchmark • MIPS = time on VAX / time on X • So, if benchmark takes 100 sec on VAX and 4 sec on X, then X is a 25 MIPS machine
Cautions in calculating MIPS • Benchmarks for all machines should be compiled by similar compilers with similar settings • Need to control and explicitly sate the configuration (cahce size, buffer sizes, etc.)
Features of interest for evaluation: • Integer arithmetic • Floating point arithmetic • Cache management • Paging • I/O • Could test one at a time … or, using synthetic program, exercise all at once
Synthetic programs .. • Evaluate multiple features simultaneously, parameterized for characteristics of workload • Pro: • Beyond CPU performance, can also measure system throughput, investigate alternative strategies • Con: • Complex, OS-dependent • Difficult to choose params that accurately reflect real workload • Generates lots of raw data
“Script” approach • Have real users work on machine of interest, recording all actions of users in real computing environment • Pro: • Can compare system under control and test conditions (disk 1 v. disk 2), (buf size 1 v. buf size 2), etc. under real workload conditions • Con: • Too many dependencies, may not work on other installations – even if same machine • System neees to be up and running already • bulky
SPEC = System Performance Evaluation Cooperative (Corporation) • Mission: to establish, maintain, and endorse a standardized set of relevant benchmarks for performance evaluation of modern computer systems • SPECCPU – both int and fp version • Also for JVMs, web, graphics, other special purpose benchmarks • See: http://www.specbench.org
Methodology: • 10 benchmarks: • Integer: gcc, espresso, li, eqntott • Floating point: spice, doduc, nasa7, matrix, fpppp, tomcatv
Metrics: • SPECint : • Geometric mean of t(gcc), t(espresso), t(li), t(eqntott) • SPECfp • Geometric mean of t(spice), t(doduc), t(nasa7), t(matrix), t(fppp), t(tomcatv) • SPECmark • Geometric mean of SPECint, SPECfp
Metrics, cont’d • SPEC thruput: measure of CPU performance under moderate CPU contention • Multiprocessor with n processors : two copies of SPEC benchmark run concurrently on each CPU, elapsed time noted • SPECthruput = Time on machine X /time on VAX 11/780
Geometric mean ??? • Arithmetic mean(x1, x2…xn) • (x1+x2+…xn)/n • AM(10,50,90) = (10+50+90)/3 = 50 • Geometric mean(x1,x2,…xn) • nth root(x1*x2*…*xn) • GM(10,50,90) = (10*50*90)^1/3= 35-36 • Harmonic mean(x1,x2,..,xn) • n/ (1/x1 + 1/x2 + … + 1/xn) • HM(10,50,90) = 3/( 1/10 + 1/50 + 1/90) = 22.88
Why geometric mean? Why not AM? • Arithmetic mean doesn’t preserve running time ratios (nor does harmonic mean) – geometric mean does • Example:
Highly Parallel Architectures • For parallel machines/programs, performance depends on: • Inherent parallelism of application • Ability of machine to exploit parallelism • Less than full parallelism may result in performance << peak rate
Amdahl’s Law • f = fraction of a program that is parallelizable • 1 –f = fraction of a program that is purely sequential • S(n) = effective speed with n processors • S(n) = S(1) / (1-f) + f/n • As n->infinity, S(n) -> S(1)/(1-f)
Example • S(n) = S(1) / (1-f) + f/n • As n->infinity, S(n) -> S(1)/(1-f) • Let f = 0.5, infinite n, max S(inf) = 2 • Let f = 0.8, infinite n, max S(inf) = 5 • MIPS/MFLOPS not particularly useful for a parallel machine
Are synthetic benchmarks useful for evaluating parallel machines? • Will depend on : inherent parallelism • Data parallelism • Code parallelism
Data parallelism • multiple data items operated on in parallel by same op • SIMD machines • Works well with vectors, matrices, lists, sets • Metrics: • avg #data items operated on per op • (depends on problem size) • (#data items operated on / # data items) per op • Depends on type of problem
Code parallelism • How finely can problem be divided into parallel sub-units? • Metric: average parallelism • = Sum(n=1, inf) n f(n) • f(n) = fraction of code that can be split into at most n parallel activities • … not that easy to estimate • … not all that informative when you do .. • …dependencies may exist between parallel tasks, or between parallel and non-parallel sections of code
Evaluating performance of parallel machines is more difficult than doing so for sequential machines • Problem: • Well-designed parallel algorithm depends on number of processors, interconnection pattern (bus, crossbar, mesh), interaction mechanism(shared memory, message passing), vector register size • Solution: • pick the optimal algorithm for each machine • Problem: that’s hard to do! .. And may also depend on actual number of processors, etc. …
Other complications • Language limitations, dependencies • Compiler dependencies • OS characteristics: • Timing (communication v. computation) • Process management (light v. heavy)
More complications • Small benchmark may reside in cache (Dhrystone) • Large memory may eliminate paging for medium programs, and effects of poor paging scheme hidden • Benchmark may not have enough I/o • Benchmark may have dead code, optimizable code
Metrics • Speedup : S(p) – running time of the best possible sequential alg / rt of the parallel imp using p processors • Efficiency = S(p) /p