Download
1 / 13
130 likes | 283 Views
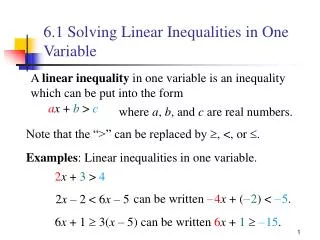
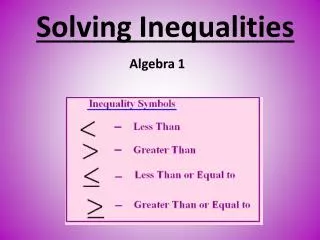
6.1 Solving Inequalities. Objectives: State and use symbols of inequality. Solve inequalities that involve addition and subtraction .

E N D
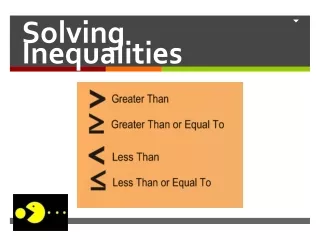
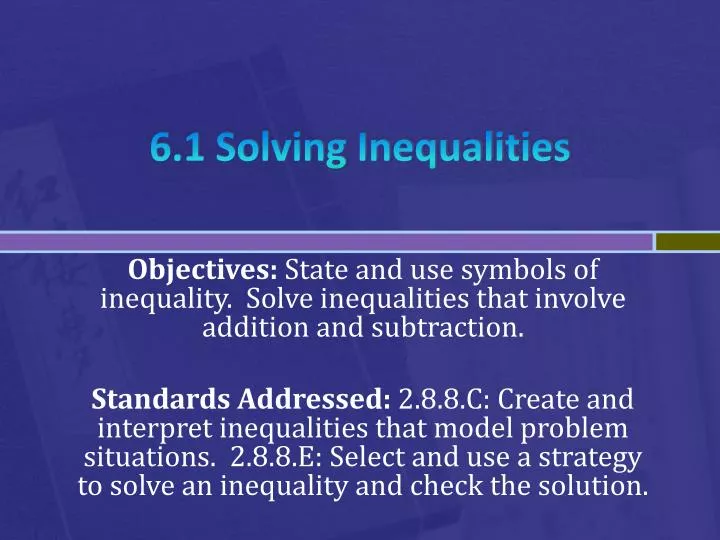
6.1 Solving Inequalities Objectives: State and use symbols of inequality. Solve inequalities that involve addition and subtraction. Standards Addressed: 2.8.8.C: Create and interpret inequalities that model problem situations. 2.8.8.E: Select and use a strategy to solve an inequality and check the solution.
Ex. 1 a. Michael can spend at most $3.10 for lunch. He buys a hamburger and a drink for $2.15. Write and inequality that models how much Michael can spend on dessert and stay within his spending limit. • D + 2.15 < $3.10
b. Trish has only $3.75 to spend for lunch. She buys a cheeseburger for $2.50. Write and inequality that models how much Trish can spend on dessert and stay within her spending limit. • D + 2.50 < $3.75
b. Solve the inequality c + 7 < -11. • c+ 7 < -11 - 7 -7 c < -18
Number Lines and Inequalities • The solution to an inequality is the set of all numbers that make the statement true. • The solution set might be listed, described, or graphed. • An inequality is graphed as an interval, a ray, or a line. Included endpoints are shown as dots, • , while endpoints not included are shown as open circles, o.
Ex. 3b. Graph the solution to t + 7 < -3. • t + 7 < -3. - 7 - 7 t < -10