Download
1 / 32
1.36k likes | 2.98k Views
6.1 Solving Linear Inequalities in One Variable. A linear inequality i n one variable is an inequality which can be put into the form. a x + b > c. where a , b , and c are real numbers . Note that the “>” can be replaced by , < , or .

E N D
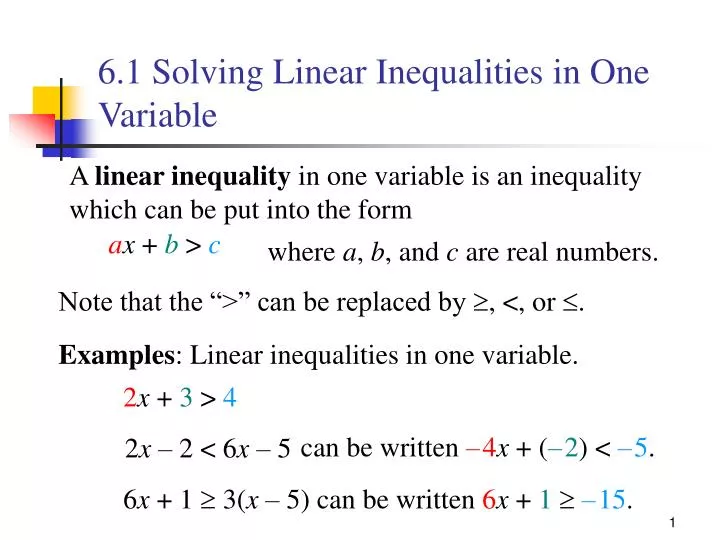
6.1 Solving Linear Inequalities in One Variable A linear inequalityin onevariable is an inequality which can be put into the form ax + b > c where a, b, and c are real numbers. Note that the “>” can be replaced by , <, or . Examples: Linear inequalities in one variable. 2x+ 3> 4 can be written –4x+ (–2)<–5. 2x – 2 < 6x – 5 6x+ 1 3(x – 5) can be written 6x+1–15.
0 0 -4 -4 -3 -3 -2 -2 -1 -1 1 1 2 2 3 3 4 4 6.1 Solving Linear Inequalities in One Variable The solution set for an inequality can be expressed in two ways. Example: Express the solution set of x <3 in two ways. Open circle indicate that the number is not included in the solution set. {x | x<3} 1. Set-builder notation: ° 2. Graph on the real line: Example:Express the solution set of x 4 in two ways. Closed circle indicate that the number is included in the solution set. {x | x4} 1. Set-builder notation: • 2. Graph on the real line:
6.1 Solving Linear Inequalities in One Variable A solution of an inequality in one variable is a number which, when substituted for the variable, results in a true inequality. Examples: Are any of the values of x given below solutions of 2x > 5? ? ? x = 2 2(2) > 5 4 > 5 False 2 is not a solution. ? ? x = 2.6 2(2.6) > 5 5.2 > 5 True 2.6 is a solution. ? ? x = 3 2(3) > 5 6 > 5 True 3 is a solution. ? ? x = 1.5 2(1.5) > 5 3 > 5 False 1.5 is not a solution. The solution set of an inequality is the set of all solutions.
6.1 Solving Linear Inequalities in One Variable The graph of a linear inequality in one variable is the graph on the real number line of all solutions of the inequality. Verbal Phrase Inequality Graph All real numbers less than 2 x < 2 All real numbers greater than -1 x > -1 All real numbers less than or equal to 4 x< 4 All real numbers greater than or equal to -3 x> -3
+ 4 + 4 6.1 Solving Linear Inequalities in One Variable Addition and Subtraction Properties • If a > b and c is a real number, then a > b, a + c > b + c, and a – c > b – c have the same solution set. • If a < b and c is a real number, then a < b, a + c < b + c, and a – c < b – c have the same solution set. Example: Solve x – 4 > 7. Add 4 to each side of the inequality. x– 4 > 7 x > 11 Set-builder notation. {x | x > 11}
– 2x – 2x 6.1 Solving Linear Inequalities in One Variable Example: Solve 3x2x + 5. Subtract 2x from each side. 3x2x + 5 x 5 {x | x5} Set-builder notation.
6.1 Solving Linear Inequalities in One Variable Multiplication and Division Properties • If c > 0 the inequalities a > b,ac > bc, and>have the same solution set. • If c < 0 the inequalities a > b,ac < bc, and<have the same solution set. Example: Solve 4x 12. 4x 12 Divide by 4. x 3 4 is greater than 0, so the inequality sign remains the same.
Example: Solve . (–3) (–3) 6.1 Solving Linear Inequalities in One Variable Multiply by –3. –3 is less than 0, so the inequality sign changes.
x > 6.1 Solving Linear Inequalities in One Variable Example: Solve x + 5 < 9x + 1. –8x + 5 < 1 Subtract 9x from both sides. –8x < –4 Subtract 5 from both sides. Divide both sides by –8 and simplify. Inequality sign changes because of division by a negative number. Solution set in set-builder notation.
Example: Solve . Subtract from both sides. -20 -10 0 10 20 30 40 50 60 6.1 Solving Linear Inequalities in One Variable Add 2 to both sides. Multiply both sides by 5. • Solution set as a graph.
6.2 Problem Solving Example: A cell phone company offers its customers a rate of $89 per month for 350 minutes, or a rate of $40 per month plus $0.50 for each minute used. How many minutes per month can a customer who chooses the second plan use before the charges exceed those of the first plan? Let x = the number of minutes used. Solve the inequality 0.50x + 40 89. 0.50x 49 Subtract 40. x 24.5 Divide by 0.5. The customer can use up to 24.5 minutes per month before the cost of the second plan exceeds the cost of the first plan.
6.3 Compound Inequalities A compound inequality is formed by joining two inequalities with “and” or “or.”
0 -4 -3 -2 -1 1 2 3 4 6.3 Compound Inequalities Example: Solve x + 2 < 5 and 2x – 6 > – 8. Solve the first inequality. Solve the second inequality. x +2 < 5 2x – 6 > – 8 x < 3 2x > – 2 Subtract 2. Add 6. {x | x < 3} x > – 1 Divide by 2. Solution set {x | x > –1} Solution set The solution set of the “and” compound inequality is the intersection of the two solution sets. ° º
0 -4 -3 -2 -1 1 2 3 4 6.3 Compound Inequalities When solving compound inequalities, it is possible to work with both inequalities at once. This inequality means 11 < 6x + 5 and 6x + 5 < 29. Example: Solve 11 < 6x + 5 < 29. 6 < 6x < 24 Subtract 5 from each of the three parts. 1 < x < 4 Divide 6 into each of the three parts. Solution set.
Example: Solve . 0 -4 -3 -2 -1 1 2 3 4 6.3 Compound Inequalities Subtract 6 from each part. Multiply each part by –2. Multiplication by a negative number changes the inequality sign for each part. • • Solution set.
0 -4 -3 -2 -1 1 2 3 4 6.3 Compound Inequalities Example: Solve x + 5 > 6 or 2x < –4. Solve the first inequality. Solve the second inequality. x + 5 > 6 2x < –4 x > 1 x < –2 { x | x > 1} { x | x < –2} Solution set Solution set Since the inequalities are joined by “or” the solution set is the union of the solution sets. ° °
6.4 Absolute Value and Inequalities There are 4 types of absolute value inequalities and equivalent inequalities • |x| < a • |x| <a • |x| > a • |x| >a
6.4 Absolute Value and Inequalities Translating Absolute Value Inequalities • The inequality |ax + b| < c is equivalent to -c < ax + b < c • The inequality |ax + b| > c is equivalent to ax + b < -c or ax + b > c
0 -4 -3 -2 -1 1 2 3 4 º º 6.4 Absolute Value and Inequalities Example Solve |x - 4| < 3 • -3 < x - 4 < 3 • 1 < x < 7 • The solution set is {x| 1 < x < 7} and the interval is (1, 7)
0 -4 -3 -2 -1 1 2 3 4 6.4 Absolute Value and Inequalities Example Solve |4x - 1| < 9 • -9 ≤ 4x - 1 ≤ 9 • -8 ≤ 4x≤ 10 • -2 ≤x≤ 5/2 • The interval solution is [-2, 5/2]
0 -4 -3 -2 -1 1 2 3 4 º º 6.4 Absolute Value and Inequalities Solve |x| > a • Solve |x + 1| > 2 • x + 1 < -2 or x + 1 > 2 • x < -3 or x > 1 • The solution interval is (-∞, -3) U (1, ∞)
0 -4 -3 -2 -1 1 2 3 4 • • 6.4 Absolute Value and Inequalities Solve |x| ≥a • Solve |2x - 8| ≥ 4 • 2x – 8 ≤ -4 or 2x - 8 ≥ 4 • 2x≤ 4 or 2x≥ 12 • x≤ 2 or x≥ 6 • The solution interval is (-∞, 2] U [ 6, ∞)
6.5 Linear Inequalities • A linear inequality in two variables can be written in any one of these forms: • Ax + By < C • Ax + By > C • Ax + By ≤ C • Ax + By ≥ C • An ordered pair (x, y) is a solution of the linear inequality if the inequality is TRUE when x and y are substituted into the inequality.
6.5 Linear Inequalities • Which ordered pair is a solution of 5x - 2y ≤ 6? • (0, -3) • (5, 5) • (1, -2) • (3, 3)
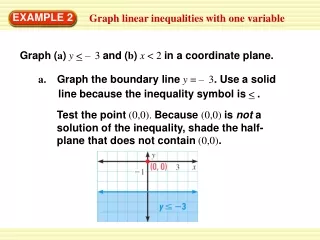
6.5 Linear Inequalities • The graph of a linear inequality is the set of all points in a coordinate plane that represent solutions of the inequality. • We represent the boundary line of the inequality by drawing the function represented in the inequality.
6.5 Linear Inequalities • The boundary line will be a: • Solid line when ≤ and ≥ are used. • Dashed line when < and > are used. • Our graph will be shaded on one side of the boundary line to show where the solutions of the inequality are located.
6.5 Linear Inequalities Here are some steps to help graph linear inequalities: • Graph the boundary line for the inequality. Remember: • ≤ and ≥ will use a solid curve. • < and > will use a dashed curve. • Test a point NOT on the boundary line to determine which side of the line includes the solutions. (The origin is always an easy point to test, but make sure your line does not pass through the origin) • If your test point is a solution (makes a TRUE statement), shade THAT side of the boundary line. • If your test points is NOT a solution (makes a FALSE statement), shade the opposite side of the boundary line.
y 5 x -5 -5 5 6.5 Linear Inequalities • Graph the inequality x ≤ 4 in a coordinate plane • Decide whether to use a solid or dashed line. • Use (0, 0) as a test point. • Shade where the solutions will be.
y 5 x -5 -5 5 6.5 Linear Inequalities • Graph y>x + 2 in a coordinate plane. • Sketch the boundary line of the graph. • Solid or dashed line? • Use (0, 0) as a test point. • Shade where the solutions are.
y 5 x -5 -5 5 6.5 Linear Inequalities • Graph y> -½x - 2 in a coordinate plane. • Sketch the boundary line of the graph. • Solid or dashed line? • Use (0, 0) as a test point. • Shade where the solutions are.
y 5 x -5 -5 5 6.5 Linear Inequalities • Graph 3x - 4y > 12 in a coordinate plane. • Sketch the boundary line of the graph. • Find the x- and y-intercepts and plot them. • Solid or dashed line? • Use (0, 0) as a test point. • Shade where the solutions are.
y 5 x -5 -5 5 Example 4: Using a new Test Point • Graph y < 2/5x in a coordinate plane. • Sketch the boundary line of the graph. • Find the x- and y-intercept and plot them. • Both are the origin! • Use the line’s slope to graph another point. • Solid or dashed line? • Use a test point OTHER than the origin. • Shade where the solutions are.