Download
1 / 38
380 likes | 422 Views
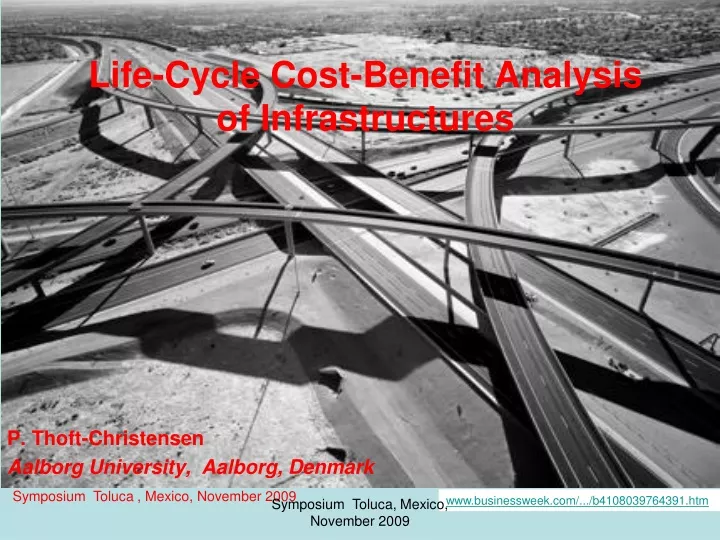
Life-Cycle Cost-Benefit Analysis of Infrastructures. P. Thoft-Christensen Aalborg University, Aalborg, Denmark. Symposium Toluca , Mexico, November 2009. www.businessweek.com/.../b4108039764391.htm. 1. OUTLINE. Motivation Three founders of LC-CB analysis Social return on Investment

E N D
Life-Cycle Cost-Benefit Analysis of Infrastructures P. Thoft-Christensen Aalborg University, Aalborg, Denmark Symposium Toluca , Mexico, November 2009 www.businessweek.com/.../b4108039764391.htm Symposium Toluca, Mexico, November 2009 1
OUTLINE • Motivation • Three founders of LC-CB analysis • Social return on Investment • Traditional formulations • The Future Transport Infrastructure in Denmark Symposium Toluca, Mexico, November 2009 2
CALIFORNIA MARINE TRANSPORTATION SYSTEM INFRASTRUCTURE NEEDS http://www.mtsnac.org/docs/CALMITSAC_%20MTS_%20Infrastructure_Needs%2010_22_03.htm Symposium Toluca, Mexico, November 2009 3 3
The flow of goods to and from California ports and along associated inland transportation corridors must be recognized for the huge economic benefit it brings to the producers, manufacturers, transporters and consumers of those goods throughout the entire nation. • Given the magnitude of this flow of goods, Congress must establish viable funding sources that will allow the goods movement infrastructure to keep pace with the steadily increasing growth of this sector. This may entail the creation of new sources of funds given that existing funding programs are already oversubscribed and/or dedicated. • The funding needs of the MTS in California are great and cover a broad range of modes and facilities. The total funding need for the recommended MTS projects in California is $23.7 billion ($7.2 billion in Northern California and $16.5 billion in Southern California.) Symposium Toluca, Mexico, November 2009 Symposium Toluca , Mexico, November 2009 4 4
Cost-benefit analysisis a term that refers both to: • to help appraise, or assess, the case for a project or proposal • an informal approach to making decisions of any kind. • Under both definitions the process involves, whether explicitly or implicitly, weighing the total expected costs against the total expected benefits of one or more actions in order to choose the best or most profitable option. • Benefits and costs are often expressed in money terms, and are adjusted for the time value of money, so that all flows of benefits and flows of project costs over time (which tend to occur at different points in time) are expressed on a common basis in terms of their “present value.” Symposium Toluca, Mexico, November 2009 5 5
What is needed to perform a Life-Cycle Cost- Benefit Analysis of Infrastructures? • Engineering knowledge • Economic understanding • Mathematical experience Symposium Toluca, Mexico, November 2009 6
Jules Dupuit (1804-1866) • He was born in Fossano, Italy then under the rule of Napoleon Bonaparte. • At the age of ten he emigrated to France with his family where he studied in Versailles - winning a Physics prize at graduation. • He then studied in the Ecole Polytechnic as a civil engineer. • He gradually took on more responsibility in various regional posts. • He received a Légion d'honneur in 1843 for his work on the French road system, and shortly after moved to Paris. • He also studied flood management in 1848 and supervised the construction of the Paris sewer system. • Engineering knowledge • Economic understanding • Mathematical experience http://www.economyprofessor.com/theorists/julesdupuit.php Symposium Toluca, Mexico, November 2009 7 7
Assume that the consumer is originally in equilibrium when the price of water is at p1 and the quantity taken is q1. • Now assume with Dupuit that the price of water falls to p2. At the lower price for water the individual is in disequilibrium at point c. • The marginal utility of the last unit of the consumer's existing stock is greater than the now-lower marginal utility of water represented by the lower price. • In terms of price, what the consumer would pay for q1 of water is greater than the price he or she must pay for quantity q1 • The same quantity of water (q1) could be bought at a lower total expenditure, but Dupuit assumed that the consumer would not do this. Dupuit constructed this demand curve in 1844. Symposium Toluca, Mexico, November 2009 Symposium Toluca , Mexico, November 2009 8 8
Alfred Marshall (1842-1924) • Alfred Marshall was born in London. • Professor of Political Economy at the University of Cambridge from 1885 to 1908. • He was the founder of the Cambridge School of Economics which rose to great eminence in the 1920s and 1930s: • Arthur Cecil Pigouand John Maynard Keynes, the most important figures in this development, were among his pupils. • Alfred Marshall's magnum opus, the Principles of Economics (Marshall, 1890a) was published in 1890 and went through eight editions in his lifetime. • It was the most influential treatise of its era and was for many years the Bible of British economics, introducing many still-familiar concepts. • Engineering knowledge • Economic understanding • Mathematical experience http://www.economyprofessor.com/theorists/alfredmarshall.php Symposium Toluca, Mexico, November 2009 Symposium Toluca , Mexico, November 2009 9 9
His specialty was microeconomics—the study of individual markets and industries, as opposed to the study of the whole economy. • In his most important book, Principles of Economics, Marshall emphasized that the price and output of a good are determined by both supply and demand: the two curves are like scissor blades that intersect at equilibrium. • Modern economists trying to understand why the price of a good changes still start by looking for factors that may have shifted demand or supply, an approach they owe to Marshall. Symposium Toluca, Mexico, November 2009 Symposium Toluca , Mexico, November 2009 10 10
Vilfredo Pareto (1848 – 1923) was an Italianindustrialist, sociologist, economist, and philosopher. • He made several important particularly in the study of income distribution contributions to economics, and in the analysis of individuals' choices. Vilfredo Pareto • His legacy as an economist was profound. • Partly because of him, the field evolved from a branch of social philosophy as practiced by Adam Smith into a data intensive field of scientific research and mathematical equations. • Engineering knowledge • Economic understanding • Mathematical experience Symposium Toluca, Mexico, November 2009 Symposium Toluca , Mexico, November 2009 11 11 1919
Pareto optimality. A Pareto-optimal allocation of resources is achieved when it is not possible to make anyone better off without making someone else worse off. Given a set of choices and a way of valuing them, the Pareto frontier or Pareto set is the set of choices that are Pareto efficient. The Pareto frontier is particularly useful in engineering: by restricting attention to the set of choices that are Pareto-efficient, a designer can make tradeoffs within this set, rather than considering the full range of every parameter. Example of a Pareto frontier. The boxed points represent feasible choices, and smaller values are preferred to larger ones. Point C is not on the Pareto Frontier because it is dominated by both point A and point B. Points A and B are not strictly dominated by any other, and hence do lie on the frontier Symposium Toluca, Mexico, November 2009 Symposium Toluca , Mexico, November 2009 12 12
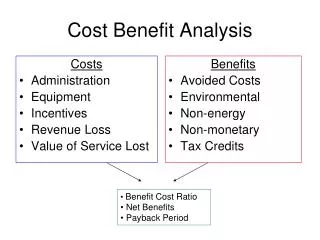
Traditional Formulations Expected Advantage = Expected Benefits - Expected Costs User costs are in most cases the dominating factor. General Formulations More general formulations include also factors which are not easy or impossible to include such as environmental and social costs. Symposium Toluca, Mexico, November 2009 Symposium Toluca , Mexico, November 2009 13 13
The traditional formulation may be used in cases like: • Comparing a small number of bridges proposals, • Deciding whether e.g. a bridge should be repaired or replaced, • Planning a maintenance strategy for a group of bridges, • Reliable data are not available. • The limitations are: • A number important factors are left out, • Cannot be used for a major infrastructure. In this presentation problems and data related to a complicated major infrastructure net consisting of roads structures, harbours, air ports, etc is discussed. Symposium Toluca, Mexico, November 2009 14
Social ReturnonInvestment (SROI) • SROI is an approach to understanding and managing the impacts of a project, an organization or a policy. • It is based on stakeholders and puts financial values on the important impacts identified by stakeholders which do not have market values. • The aim is to include the that are often excluded from markets in the same terms as used in markets, that is money, in order to give people a voice in resource allocation decisions. • SROI analysis refers not to one single ratio but more to a way of reporting on value creation. • It bases the assessment of value in part on the perception and experience of stakeholders, finds indicators of what has changed and tells the story of this change and, where possible, uses monetary values for these indicators. Symposium Toluca, Mexico, November 2009 15
The Future Transport Infrastructure in Denmark Symposium Toluca, Mexico, November 2009 Symposium Toluca , Mexico, November 2009 16 16
The Danish Infrastructure Commission was appointed in 2006: "the overall objective is for Denmark to maintain and develop its position as one of the countries in the world with the best transport systems” • To analyze and assess the key challenges and development potential for the infrastructure and national traffic investments until 2030. • To identify and assess the strategic options and priorities and to put forward suggestions to strengthen the basis for the national investment decisions in the transport area. Systematic and economic prioritization of the governmental investments in the transport infrastructure. Symposium Toluca, Mexico, November 2009 17
Background • The opportunities and the welfare of the individual citizen depends of a modern and efficient infrastructure. • The growing globalization and development in EU will result in an significant increase in international goods transport. • The overall objectives are for Denmark to develop its position as one of the leading countries regarding transport systems. • This will require profitable investments in a new and modern infrastructure to establish the best settings for high mobility and effective logistics. • However, it is at the same time important to take into account the consequences, the increasing traffic may result in, for the environment, the noise, and safety. Symposium Toluca, Mexico, November 2009 18
Mobility is important to us as individuals to be able to do the things we want – and the individual has mobility as a high priority. • Almost everybody is in contact with the transport system on a daily basis – in our way to work, to visit family, to leisure activities or to travel to the countryside. • The average Dane spends more time on transport than on completing their primary education. • Danish households spend an average 15 pr. Of their income on transport. That is more than we spend on food. Symposium Toluca, Mexico, November 2009
Motorways 1022 km Motor traffic roads 316 km Main roads 2460 km Area 44000 km Population 6.5 million The Existing Road Infrastructure Major Roads Symposium Toluca, Mexico, November 2009 20
Railway Net Symposium Toluca, Mexico, November 2009 21
Harbours • 120 harbours • 100 mio. tons of goods • 70% international • 30% domestic Symposium Toluca, Mexico, November 2009 22
Air ports More than 100 international destinations Copenhagen Symposium Toluca, Mexico, November 2009 23
Traffic 1984-2004 In average 15,000 km per year 2% increase per year 180 140 100 80 Cars Railways Busses Airplanes Ferries 1984 1990 1995 2000 2004 Symposium Toluca, Mexico, November 2009 24
Transport of Goods Ships Trains Trucks Symposium Toluca, Mexico, November 2009 25
Consequences of Infrastructure Changes • Environmental – climate • Noise • Traffic safety • Landscape • Fauna Symposium Toluca, Mexico, November 2009 26
Environmental Consequences - Emissions Traffic Symposium Toluca, Mexico, November 2009 27
1000 tons Road Traffic Railways Air Planes Ships Total Symposium Toluca, Mexico, November 2009
Traffic Safety Number of persons killed in the traffic Car km in billions Symposium Toluca, Mexico, November 2009 29
0-10,000 per 24 hours 40,000 - 60,000 > 100,000 Estimated Road Traffic in 2030 Increased traffic is 70 %. 2005 2030 Symposium Toluca, Mexico, November 2009 30
0 – 20 hours per 24 hours 500 – 800 hours > 2,000 hours Estimated Crowded Road Traffic in 2030 Hotpoints 2005 2030 Symposium Toluca, Mexico, November 2009
Cost-Benefit Analysis Three different methods are used to present the results of a cost-benefit analysis. Net Present Value The total value for the society of the advantages and disadvantages in the expected life-time discounted back to the present. Benefit-Cost Relation The present value for the society of 1 $ invested by the society. The Internal Rate The internal rate is the corresponding to a project net present value equal to zero. Symposium Toluca, Mexico, November 2009 32
Example Cost-Benefit Analysis Enlarge the existing motorway or build a new? Symposium Toluca, Mexico, November 2009
Quantitative consequences may be important, but are treated otherwise. Symposium Toluca, Mexico, November 2009 34
Effects included in LCCB analysis in Denmark • Construction costs • Inconveniences during the construction • Working expenses • Travel time reductions • Traffic safety • Noise • Local and global air pollution • Polluted soil and ground water • Area application • Indirect effects Symposium Toluca, Mexico, November 2009 35
Effects not included in LCCB analysis in DenmarkInfluence on the surroundingsVibrationsLoss of landscape valuesLoss of cultural artifacts values Symposium Toluca, Mexico, November 2009
To ensure the appropriate use of resources six concrete focus areasare recommended until 2030: • The ring connections must be completed in the Copenhagen area on roads and rail • A complete plan for the development of the infrastructure in the urban region of East Jutland must be prepared • Effective linking of the individual regions to the overall transport corridors and hubs must be ensured • The Danish gateways to the rest of the world must form a central part of an effective transport network • Intelligent technological solutions must ensure optimal utilization of the infrastructure • The effort to limit the impact of transport on the environment and the climate must be intensified. Symposium Toluca, Mexico, November 2009 37
Governmental Infrastructure Budget 2010 -1020 Investment in billions DKR Symposium Toluca, Mexico, November 2009