Download
1 / 36
400 likes | 895 Views
Life Cycle Cost Analysis. CE 7640: Fall 2002. Tapan K. Datta, PhD, PE. What is Life Cycle Cost (LCC) Analysis?. A method of calculating the cost of a system over its entire life span. Objectives of LCC Analysis.

E N D
Life Cycle Cost Analysis CE 7640: Fall 2002 Tapan K. Datta, PhD, PE
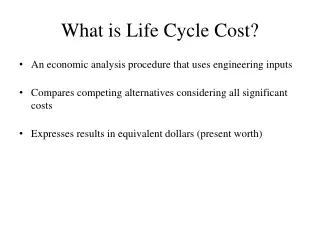
What is Life Cycle Cost (LCC) Analysis? A method of calculating the cost of a system over its entire life span.
Objectives of LCC Analysis Evaluate the economic effectiveness of different mutually exclusive investment alternatives over a certain period Identify the most cost-effective alternative
Analysis Period A time frame that is sufficiently long to reflect differences in performance among different strategy alternatives.
Selection of Analysis Period It is necessary to select an analysis period over which the alternatives are compared.
Pavement Rehabilitation Project Analysis period is considered starting at the end of the performance period of the original pavement.
Rehabilitation strategy analysis period beginning at the end of original pavement performance period
Example 1Common Performance Period All the investment alternatives have the same performance period.
Common Performance Period Performance curves for rehabilitation alternatives expected to exhibit notably different performance over the common performance period.
Selection of analysis period for alternatives with common performance period, but different performance
Options for Defining the Analysis Period The least common multiple of the performance periods of all the alternatives The shortest of the performance periods among the alternatives The longest of the performance periods of the alternatives Some other time period
Comparisons of Various Options For relatively longer performance periods, use of least common multiple of the performance periods can result in an extremely long and unrealistic analysis period. The use of shortest performance period may adversely affect those alternatives with better long-term performance and favor those with short performance periods. The longest performance periods is recommended as the analysis period.
Example 2Unequal Performance Periods Alternatives having different performance periods, which are expected to be able to keep the pavement condition above the minimum acceptable level for different lengths of time.
Unequal Performance Periods The analysis period is recommended to be no less than the performance period of the longest surviving alternative. Using a shorter analysis period (equal to the performance period of one of the shorter-lived alternatives) would not fully capture the anticipated differences in performance.
Selection of analysis period for alternatives with unequal performance periods
Unequal Performance Periods While using a longer analysis period, the follow-up rehabilitation treatments would have to be assigned to all three alternatives.
Selection of analysis period to encompass follow-up rehabilitation for all alternatives
Comments One or more of the alternatives may have a follow-up rehabilitation performance period which extends beyond the end of the analysis period. FHWA recommends an analysis period of at least 35 years for all projects (new construction as well as rehabilitation)
Bottom Line of Analysis Period Analysis period should be selected sufficiently long to reflect significant differences in performance among the different strategy alternatives.
Discount Rate Refers to the rate of change of true value of money over time, considering fluctuations in both investment interest rates and the rate of inflation. Discount rate is approximately equal to the interest rate minus the inflation rate.
Selection of Interest Rate Philosophy 1: A zero interest rate is appropriate when tax monies are used for financing. Philosophy 2: The interest rate need only reflect the “societal rate of time preference”.
Selection of Interest Rate Philosophy 3: The appropriate interest rate is dictated by the opportunity cost of those investments forgone by private investors who pay taxes or purchase bonds.
Selection of Interest Rate Philosophy 4: The appropriate interest rate is dictated by the opportunity cost of those investments forgone by budget agencies due to budget constraints.
Selection of Interest Rate Philosophy 5: The interest rate should match that paid by government for borrowed money. The rate at which governments can borrow money is felt to be appropriate for evaluating highway improvement projects.
Typical Discount Rate Discount rates used by State DOTs in life cycle cost analysis vary from 0 to 10 percent, with typical values between 3 and 5 percent, and overall average rate of 4 percent.
Monetary Agency Cost Costs associated with the alternative that are incurred by the agency during the analysis period, which can be expressed in monetary terms.
Monetary Agency Cost Includes the following: Initial rehabilitation design and construction costs Follow-up rehabilitation design and construction costs Annual maintenance costs Traffic control costs during construction Demolition and removal costs, or residual value of the pavement structure
User Costs Costs associated with the alternative that are incurred by the users of a roadway over the analysis period, which can be expressed in monetary terms.
Categories of User Costs Vehicle operating costs -fuel and oil, wear on tires and other parts, registration, insurance, and others Delay costs - due to reduced speed and/or use of alternate routes Crash costs - damage to the user’s/other vehicles, public/private property, as well as injuries
Vehicle Operating Costs In-service vehicle operating costs are a function of pavement serviceability level, which is often difficult to estimate. Tools are available to model these costs, such as World Bank’s Highway Design and Maintenance Standards Model (HDM-III), FHWA’s Highway Investment Analysis Package (HIAP-Revised), AASHTO Red Book, and others.
Delay Costs Costs associated with the value of time. Vary by vehicle class, trip type and trip purpose. A function of demand for use of the roadway with respect to roadway capacity. Work zone user delay costs may be significantly different for different rehabilitation alternatives.
Crash Costs In-service crash rates for different roadway functional classes and crash severities are well known. Work zone crash rates may differ significantly for different rehabilitation alternatives.
Other Monetary Costs Those incurred by parties other than the agency or the users of the roadway. Owners of properties and businesses adjacent to or near the route under study. Municipalities whose sales tax receipts might be reduced during the period that the nearby businesses were adversely affected.
Salvage Value The residual value that can be attributed to the alternative at the end of the analysis period. The value that the item would have in the market place. Must be defined the same way for all alternatives.
Compare Strategies Present Worth Equivalent Uniform Annual Cost Future Worth Internal Rate of Return External Rate of Return Benefit/Cost Ratio Payback Period Capitalized Worth
Sensitivity of Life Cycle Cost Analysisto Key Parameters Factors that are more sensitive: The analysis period and performance period The predicted traffic over the design and analysis periods The initial investment The discount rate The timing of follow-up maintenance and rehabilitation activities The quantities associated with initial and follow-up maintenance and rehabilitation