Download
1 / 40
400 likes | 539 Views
1. CHAPTER. Overview of Financial Statement Analysis. Business Analysis. Evaluate Risks. Evaluate Prospects. Business Decision Makers Equity investors Creditors Managers Merger and Acquisition Analysts External Auditors Directors Regulators Employees & Unions Lawyers. Quantitative

E N D
1 CHAPTER Overview of Financial Statement Analysis
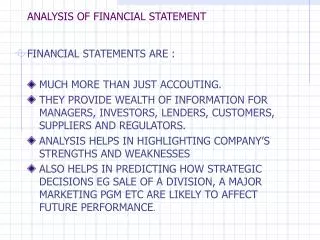
Business Analysis Evaluate Risks Evaluate Prospects Business Decision Makers • Equity investors • Creditors • Managers • Merger and Acquisition Analysts • External Auditors • Directors • Regulators • Employees & Unions • Lawyers
Quantitative Financial Statements Industry Statistics Economic Indicators Regulatory filings Trade reports Qualitative Management Discussion & Analysis Chairperson’s Letter Vision/Mission Statement Financial Press Press Releases Web sites Information Sources forBusiness Analysis
Credit Analysis Equity Analysis Management & Control Labor Negotiations Types of Business Analysis Director Oversight Regulation External Auditing Financial Management Mergers, Acquisitions & Divestitures
Trade Creditors Provide goods or services Most short-term Usually implicit interest Bear risk of default Non-trade Creditors Provide major financing Most long-term Usually explicit interest Bear risk of default Credit Analysis Creditors
Liquidity Ability to meet short-term obligations Focus: Current Financial conditions Current cash flows Liquidity of assets Solvency Ability to meet long-term obligations Focus: Long-term financial conditions Long-term cash flows Extended profitability Credit Analysis Credit worthiness: Ability to honor credit obligations (downside risk)
Intrinsic Value(or Fundamental Value) Value of Company (or stock) without reference to market value (or stock price) Strategy Intrinsic value > Market value Buy Intrinsic value < Market value Sell Intrinsic value = Market value Hold
Business Environment & Strategy Analysis Industry Analysis Strategy Analysis Prospective Analysis Accounting Analysis Financial Analysis Analysis of Sources &Uses of Funds Risk Analysis Profitability Analysis Cost of Capital Estimate Intrinsic Value
Accounting Analysis Process to evaluate and adjust financial statements to better reflect economic reality Comparability problems — across firms and across time Manager estimation error Distortion problems Earnings management Distortion of business Accounting Risk
Financial Analysis Process to evaluate financial position and performance using financial statements Profitability analysis—Evaluate return on investments Risk analysis ——— Evaluate riskiness & creditworthiness Sources and uses —Evaluate source & of funds analysis deployment of funds Common tools Ratio analysis Cash flow analysis
Prospective Analysis Process to forecast future payoffs Business Environment & Strategy Analysis Accounting Analysis Financial Analysis Intrinsic Value
Dynamics of Business Activities Business Activities Time Beginning of period Financing Investing Planning Operating Investing Financing Planning End of period
Business Activities Pricing Competition Market demands Tactics Planning Activities: Goals & Objectives Promotion Distribution Projections Managerial performance Opportunities Obstacles
Business Activities Financing activities • Owner (equity) • Nonowner (liabilities) Financing
Business Activities Investing activities • Buying resources • Selling resources Investing Financing Investing = Financing
Business Activities Planning Activities Financial Activities Investing Activities Operating Activities Revenues and expenses from providing goods and services
Financial Statements Reflect Business Activities Planning Financing Current: • Notes Payable • Accounts Payable • Salaries Payable • Income Tax Payable Noncurrent: • Bonds Payable • Common Stock • Retained Earnings Investing Current: • Cash • Accounts Receivable • Inventories • Marketable Securities Noncurrent: • Land, Buildings, & Equipment • Patents • Investments Operating • Sales • Cost of Goods Sold • Selling Expense • Administrative Expense • Interest Expense • Income Tax Expense Net Income Liabilities & Equity Income statement Assets Cash Flow Balance Sheet Balance Sheet Statement of Cash Flows Statement of Shareholders’ Equity
Financial Statements • Balance Sheet • Income Statement • Statement of Shareholders’ Equity • Statement of Cash Flows
Kodak Dec 31, 2001 (In millions, except per share data) Liabilities and Shareholders’ Equity Assets Current Liabilities Current Assets $ 3,276 Payables Cash and cash equivalents $ 448 Short-term borrowings 1,378 Receivables 2,337 Accrued income taxes 544 Inventories 1,137 Current maturities of LTD 156 Deferred income tax charges 521 5,354 Total current liabilities Other 240 Total current assets 4,683 Other Liabilities Properties Long-term borrowings 1,666 Land, buildings and equipment at cost 12,982 Post-employment liabilities 2,728 Less: Accumulated depreciation 7,323 720 Other long-term liabilities Net properties 5,659 10,468 Total liabilities Other Assets Goodwill (net of accumulated amortization of $920) 948 Shareholders' Equity Other non-current assets 2,072 Common stock, par value $2.50 per share, Total Assets $ 13,362 950,000,000 shares authorized; issued 391,292,760 shares 978 Additional paid in capital 849 7,431 Retained earnings Accumulated other comprehensive loss (597) 8,661 5,767 Treasury stock, as cost, 100,363,059 shares Total shareholders' equity 2,894 Total liabilities and equity $ 13,362
Balance Sheet Total Investing = Total Financing = Creditor Financing + Owner Financing Kodak Financing $13,362 = $10,468 + $2,894
Income Statement Kodak For Year Ended Dec. 31, 2001 (In millions) Sales $13,234 Cost of goods sold 8,670 Gross profit 4,564 Selling, general and administrative expenses 2,627 Research and development costs Goodwill amortization 779 154 Restructuring costs and asset impairments 659 EARNINGS FROM OPERATIONS 345 Interest expense 219 Other income (charges) (18) Earnings before income taxes 108 Provision for income taxes 32 NET EARNINGS 76
Statement of Shareholders’ Equity Kodak For year ended Dec. 31, 2001 Accumulated Additional Other Treasury Common Pail In Retained Comprehensive Stock Stock Capital Earnings Income (Loss) Total (In millions, except number of shares) 978 871 7,869 (482) (5,808) 3,428 Shareholders’ Equity Dec 31, 2000 - - 76 - - 76 Net earnings Other comprehensive income (loss): Unrealized holding gains arising during (21) - - - (21) - period ($34 million pre-tax) Reclassification adjustment for gains included 8 in net earnings ($13 million pre-tax) - - - 8 - - - - (98) - (98) Currency translation adjustment Minimum pension liability adjustment - - - (37) - (37) ($7 million pre-tax) - - - 33 33 Hedging gains (losses) (115) (115) - - - Comprehensive loss - (514) - - (514) - - Cash dividends declared (41) - - - - (41) Treasury stock repurchased (3,541,295 shares) Treasury stock issued under employee plans 57 - (25) - - 82 (1,393,105 shares) 3 3 Tax reductions – employee plans - - - - $2,894 $978 $849 $7,431 $ (597) ($5,767) Shareholders’ Equity Dec 31, 2001
Statement of Cash Flows Kodak For year Ended Dec. 31, 2001 (In millions) Cash flows from operating activities: Net Earnings $ 76 Adjustments to reconcile to net cash provided by operating activities: 919 Depreciation and amortization Restructuring costs 830 (44) Provisions (benefit) for deferred income taxes (Increase) decrease in receivables 252 (Increase) decrease in inventories 461 (Decrease) increase in liabilities excluding borrowings (529) Other items, net 100 Net cash provided by operating activities 2,065 Cash flow from Investing activities: (743) Additions to properties Acquisitions, net of cash acquired (306) Marketable securities - sales 54 Marketable securities - purchases (52) Net cash used in investing activities (1,047) Cash flows from financing activities: Net increase (decrease) in borrowings with original maturities of 90 days or less (695) Proceeds from other borrowings 1,907 (1,355) Repayment of other borrowings Dividends to shareholders (643) Exercise of employee stock options 22 Stock repurchase programs (44) Net cash provided by (used in) financing activities (808) (8) Effect of exchange rate changes on cash Net (decrease) increase in cash and cash equivalents 202
Statement of Cash Flows for Year Ended Dec. 31, 2001 Operating Cash flows $ 2,065 Investing Cash flows (1,047) Financing Cash flows (808) Exchange rate changes on cash (8) Net Change in Cash $ 202 Cash Balance, Dec. 31, 1997 246 Cash Balance, Dec. 31, 1998 $ 448 Balance Sheet Dec. 31, 2000 Assets Cash $ 246 Non-Cash Assets 13,966 Total Assets $14,212 Liabilities & Equity Total liabilities $ 10,784 Equity: Share Capital 1,849 Retained Earnings 7,387 Treasury Stock (5,808) Total equity $ 3,428 Liabilities & Equity $14,212 Balance Sheet Dec. 31, 2001 Assets Cash $ 448 Non-Cash Assets 12,914 Total Assets $13,362 Liabilities & Equity Total liabilities $10,468 Equity: Share Capital 1,827 Retained Earnings 6,834 Treasury Stock (5,767) Total equity $ 2,894 Liabilities & Equity $13,362 Income Statement for Year Ended Dec. 31, 2001 Sales $13,234 Expenses (13,158) Net Earnings $ 76 Other Comprehensive Income (115) Comprehensive Income $ (39) Statement of Shareholders’ Equity for Year Ended Dec. 31, 2001 Share Capital, Dec. 31, 1997 $ 1,849 Adjustments/Stock Issue (22) Share Capital, Dec. 31, 1998 $ 1,827 Retained Earnings, Dec. 31, 1997 $ 7,387 Add: Comprehensive Income (39) Less: Dividends (514) Retained Earnings, Dec. 31, 1998 $ 6,834 Treasury Stock, Dec. 31, 1997 $ 5,808 Treasury Stock Issued 82 Treasury Stock Repurchased (41) Treasury Stock, Dec. 31, 1998 $ 5,767 Financial Statement Links - Kodak (Point in time) (Point in time) (Period of time) Dec. 31, 2000 Dec. 31, 2001
Additional Information(Beyond Financial Statements) • Management Discussion & Analysis (MD&A) • Management Report • Auditor Report • Notes to Financial Statements • Supplementary Information (10-K, 10-Q, 8-K, 20-F) • Proxy Statement • Social Responsibility Report
Analysis Preview Yr1 Yr2 Yr3 Comparative Analysis Purpose: Evaluation of consecutive financial statements Output: Direction, speed, & extent of any trend(s) Types: Year-to-year Change Analysis Index-Number Trend Analysis
Analysis Preview Kodak's Comparative Income Statements Change Change 2001 2000 (in mil.) % $ 13,234 $13,994 Sales (5.4)% $ (760) Cost of goods sold 8,670 8,375 295 3.5 $ 4,564 $ 5,619 $ (1,055) (18.8) Gross profit Operating Expenses: 2,665 Selling, general and admin. 2,781 116 4.4 784 Research and development 779 (5) (0.6) (44) Restructuring costs 659 703 - Earnings from operations (84.4) $ 345 $2,214 $(1,869) Interest Expense and other 237 82 155 189.0 - Other income (charges) - - - Earnings before income taxes $ 108 $ 2,132 $ (2,024) (94.9) 725 Provision for income taxes 32 (693) (95.6) Net earnings (94.6) $ 76 $ 1,407 $ (1,331)
Analysis Preview Common-Size Analysis Purpose : Evaluation of internal makeup of financial statements Evaluation of financial statement accounts across companies Output: Proportionate size of assets, liabilities, equity, revenues, & expenses
Analysis Preview Common-Size Analysis Kodak's Common-Size Income Statements 2001 2000 Sales 100.0% 100.0% Cost of goods sold 65.5 59.9 Gross profit 34.5% 40.1% Selling, general and administrative expenses 21.0 19.0 Research and development costs 5.9 5.6 Restructuring Costs 5.0 (0.3) Earnings from operations 2.6% 15.8% Interest expense and other costs (credits) 0.6 1.8 Earnings before income taxes 0.8% 15.2% Provision for income taxes 0.2 5.2 Net earnings 0.6% 10.0%
Analysis Preview Ratio Analysis Purpose : Evaluate relation between two or more economically important items (one starting point for further analysis) Output: Mathematical expression of relation between two or more items Cautions: Prior Accounting analysis is important Interpretation is key -- long vs short term & benchmarking
Analysis Preview Valuation Purpose: Estimate intrinsic value of a company (or stock) Basis: Present value theory (time value of money) Valuation - an important goal of many types of business analysis
Bt = It +1 + It +2 + It +3 + ... + It +n + F (1+r)1 (1+r)2 (1+r)3 (1+r)n (1+r)n Analysis Preview Debt (Bond) Valuation Bt is the value of the bond at time t It +n is the interest payment in period t+n F is the principal payment (usually the debt’s face value) r is the interest rate (yield to maturity)
Vt = E(Dt +1)+ E(Dt +2) + E(Dt +3) + ... + E(Dt +n)+ ... (1+k)1 (1+k)2 (1+k)3 (1+k)n Analysis Preview Equity Valuation Vt is the value of an equity security at time t Dt +n is the dividend in period t+n k is the cost of capital E() refers to expected dividends
Vt = E(FCFt +1) + E(FCFt +2) + E(FCFt +3) + ... + E(FCFt +n) + ... (1+k)1 (1+k)2 (1+k)3 (1+k)n Analysis Preview Equity Valuation - Free Cash Flow Model FCFt+n is the free cash flow in the period t + n [often defined as cash flow from operations less capital expenditures] k is the cost of capital E(•) refers to an expectation
Vt = BVt + E(RIt +1) + E(RIt +2) + E(RIt +3) + ... + E(RIt +n) + ... (1+k)1 (1+k)2 (1+k)3 (1+k)n Analysis Preview Equity Valuation - Residual Income Model Rit+n is the residual income in period t + n [defined as net income, NI, minus a charge on beginning book value, BV, or RIt = NIt - (k x BVt-1)] k is the cost of capital E(•) refers to an expectation
Analysis in an Efficient Market Three assumed forms of market efficiency Weak Form - prices reflect information in past prices Semi-strong Form - prices reflect all public information Strong Form - prices reflect all public and private information
Analysis in an Efficient Market Market Efficiency • assumes competent and informed analysis • distinguish aggregate from individual behavior • reflects information (both reliable and unreliable) • cross-country differences in rewards to analysis Financial statement analysis relevant to more than just market analysis, e.g., • credit and lending • auditing • valuation of nonpublicly traded firms • mergers and acquisitions • etc...
Book Organization Financial Statement Analysis Part II Accounting Analysis Part III Financial Analysis Part I Introduction and Overview Chapter 1: Overview of Financial Statement Analysis Chapter 2: Financial Reporting and Analysis Chapter 3: Analyzing Financial Activities Chapter 4: Analyzing Investing Activities Chapter 5: Analyzing Investing Activities: Special topic Chapter 6: Analyzing Operating Activities Chapter 7: Cash Flow Analysis Chapter 8: Return on Invested Capital Chapter 9: Profitability Analysis Chapter 10: Prospective Analysis Chapter 11: Credit Analysis Chapter 12: Equity Analysis and Valuation
Passive Investing (beta strategies) Aim: Diversification based on risk propensity & investment horizon Example: Indexing Active Investing (alpha strategies) Aim: Beat the market -- earn above normal stock returns Examples: Technical analysis & Fundamental analysis Credit Analysis