Download
1 / 11
190 likes | 527 Views
Next Page Click Here. Financial Statement Analysis. Covered here. Analytical techniques used to examine relationships among financial statement items. Horizontal analysis (Dollar and percentage changes on statements) Trend analysis Common-size statements (Vertical analysis)

E N D
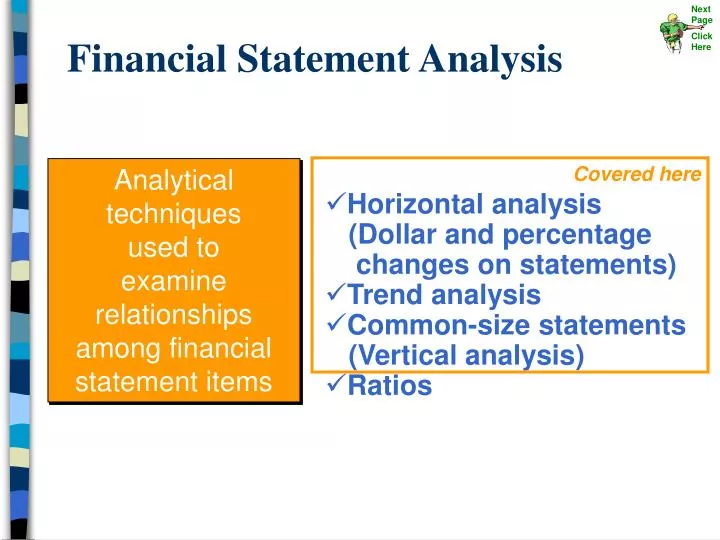
Next Page Click Here Financial Statement Analysis Covered here Analytical techniquesused toexamine relationships among financial statement items • Horizontal analysis (Dollar and percentage changes on statements) • Trend analysis • Common-size statements (Vertical analysis) • Ratios
Next Page Click Here Horizontal Analysis Horizontal analysis shows the changes between years in the financial data in both dollar and percentage form.
Next Page Click Here Dollar Change Current Year Figure Base Year Figure = – Percentage Change Dollar Change Base Year Figure × 100% = Horizontal Analysis (using comparative financial statements) Calculating Change in Dollar Amounts Calculating Change as a Percentage
Next Page Click Here Horizontal Analysis – Balance Sheet 20A is the base year $12,000 – $23,500 = $(11,500) ($11,500 ÷ $23,500) × 100% = 48.9%
Next Page Click Here Horizontal Analysis– Income Statement $520,000 – $480,000 = $40,000 $40,000 ÷ $480,000) × 100% = 8.3%
Next Page Click Here Trend Percentage Current Year Amount Base Year Amount × 100% = Trend Analysis Trend percentages state several years’ financial data in terms of a base year, which equals 100 percent.
Next Page Click Here Trend Analysis The base year is 2002, and its amounts will equal 100%. 20C Amounts ÷ 20B Amounts × 100% = trend percentage ( $290,000 ÷ $275,000 ) × 100% = 105% ( $198,000 ÷ $190,000 ) × 100% = 104% ( $ 92,000 ÷ $ 85,000 ) × 100% = 108%
Next Page Click Here Trend percentages can be used to construct a graph so the trend over time can be seen. Trend Analysis
Next Page Click Here Common-Size Statements – Vertical Analysis Common-size statements use percentages to express the relationship of individual components to a total within a single period. This approach to financial statement analysis is also known as vertical analysis.
Next Page Click Here Common-Size Statements Net sales is usually the base and is expressed as 100%.
Next Page Click Here 20B COGS ÷ 20B Net Sales × 100% ( $360,000 ÷ $520,000 ) × 100% = 69.2% 20A COGS ÷ 20A Net Sales × 100% ( $315,000 ÷ $480,000 ) × 100% = 65.6% Common-Size Statements