Download

1 / 26
260 likes | 403 Views
Chart 7.1: U.S. Population Trends and Projections by Age, 1980 – 2060 (1). Source: U.S. Department of Commerce, Bureau of the Census. Projections of the Population by Age and Sex for the United States: 2010 - 2060 . (1) Years 2015 through 2060 are projections.

E N D
Chart 7.1: U.S. Population Trends and Projections by Age, 1980 – 2060(1) Source: U.S. Department of Commerce, Bureau of the Census. Projections of the Population by Age and Sex for the United States: 2010 - 2060. (1) Years 2015 through 2060 are projections.
Chart 7.2: U.S. Population Trends and Projections by Race, 2015 – 2060(1) Source: U.S. Department of Commerce, Bureau of the Census. Projections of the Population by Sex, Race, and Hispanic Origin for the United States: 2015-2060. (1) Years 2015 through 2060 are projections. (2) All other includes American Indian, Native Alaskan, Native Hawaiian, other Pacific Islander and two or more races. (3) Black, Asian, and all other categories include Hispanic and non-Hispanic individuals.
Chart 7.3: Age-adjusted Death Rates, Selected Causes, by Race, 2010 (1) (1) Source: National Center for Health Statistics. (2014). Health, United States, 2013. Hyattsville, MD. (1) Racial categories include individuals of both Hispanic and non-Hispanic origin.
Chart 7.4: Percent of People with Chronic Conditions by Number and Sex,(1) 2011 Percent of Individuals Source: Avalere Health analysis of 2011 Medical Expenditure Panel Survey data. (1) The analysis was based on the following study: Anderson, G. (2010). Chronic Care: Making the Case for Ongoing Care. Johns Hopkins University and the Robert Wood Johnson Foundation. There were two distinct differences between Avalere‘s analysis and the study’s methodologies. First, Avalere used the Chronic Conditions as defined by the Agency for Healthcare Research and Quality Medical Expenditure Panel Survey (MEPS) documentation. Second, Avalere solely relied on MEPS 2011 data and did not use the two additional data sources that were referenced in the Anderson 2010 study (i.e., three opinion telephone surveys commissioned by the Partnership for Solutions and designed by Johns Hopkins and the 1996 Survey of Income and Program Participation data for characteristics of family caregivers).
Chart 7.5: Percent of Fee-for-Service Medicare Beneficiaries with Chronic Conditions, 2012 (1) Source: Centers for Medicare & Medicaid Services. Medicare Chronic Condition Dashboard. Data released June 2, 2014. Available at: https://www.ccwdata.org/web/guest/interactive-data/chronic-conditions-dashboard. (1) Chronic obstructive pulmonary disease. Previously Percent of People with Chronic Conditions by Type, 2006. Source: Anderson, G. (2010). Chronic Care: Making the Case for Ongoing Care. Johns Hopkins University and the Robert Wood Johnson Foundation.
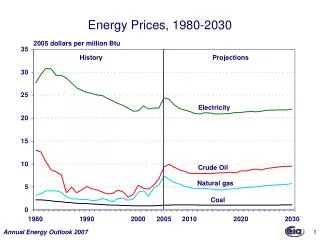
Chart 7.6: Number of Persons with Asthma, 1980 – 2012 Source: Centers for Disease Control and Prevention (2002). “Asthma Surveillance – United States, 1980-1999.” National Center for Health Statistics. National Health Interview Survey 2001, 2005, 2006, 2007, 2008, 2009, 2010, 2011 and 2012.
Chart 7.7: Percent of Adults with Hypertension by Sex,(1) 1988 – 1994 and 2009 – 2012 Source: National Center for Health Statistics. (2014). Health, United States, 2013. Hyattsville, MD. (1) Data are age-adjusted to 2000 standard population.
Chart 7.8: Percent of Adults Who Are Overweight and Obese,(1)1960 – 2012 (2) Source: National Center for Health Statistics. (2014). Health, United States, 2013. Hyattsville, MD. (1) Data are age-adjusted to 2000 standard population. (2) Overweight includes obese.
Chart 7.9: Percent of Expenses Used by People with Chronic Conditions by Service Type,(1) 2011 Source: Avalere Health analysis of 2011 Medical Expenditure Panel Survey data. (1) The analysis was based on the following study: Anderson, G. (2010). Chronic Care: Making the Case for Ongoing Care. Johns Hopkins University and the Robert Wood Johnson Foundation. There were two distinct differences between Avalere‘s analysis and the study’s methodologies. First, Avalere used the Chronic Conditions as defined by the Agency for Healthcare Research and Quality Medical Expenditure Panel Survey (MEPS) documentation. Second, Avalere solely relied on MEPS 2011 data and did not use the two additional data sources that were referenced in the Anderson 2010 study (i.e., three opinion telephone surveys commissioned by the Partnership for Solutions and designed by Johns Hopkins and the 1996 Survey of Income and Program Participation data for characteristics of family caregivers).
Chart 7.10: Percent of Spending for Individuals with Chronic Conditions by Insurance Status,(1) 2011 Source: Avalere Health analysis of 2011 Medical Expenditure Panel Survey data. (1) The analysis was based on the following study: Anderson, G. (2010). Chronic Care: Making the Case for Ongoing Care. Johns Hopkins University and the Robert Wood Johnson Foundation. There were two distinct differences between Avalere‘s analysis and the study’s methodologies. First, Avalere used the Chronic Conditions as defined by the Agency for Healthcare Research and Quality Medical Expenditure Panel Survey (MEPS) documentation. Second, Avalere solely relied on MEPS 2011 data and did not use the two additional data sources that were referenced in the Anderson 2010 study (i.e., three opinion telephone surveys commissioned by the Partnership for Solutions and designed by Johns Hopkins and the 1996 Survey of Income and Program Participation data for characteristics of family caregivers).
Chart 7.11: Percent of Medicare Fee-for-Service Beneficiaries vs. Percent of Medicare Spending, by Number of Chronic Conditions,(1) 2012 Percent of Beneficiaries (2) Percent of Medicare Spending (2) Source: Centers for Medicare & Medicaid Services. Medicare Chronic Condition Dashboard. Data released June 2, 2014. Available at: https://www.ccwdata.org/web/guest/interactive-data/chronic-conditions-dashboard. (1) Includes 15 CMS identified chronic conditions. (2) Percentages were rounded, so they do not add to 100percent. Previously Percent of Population vs. Percent of Spending, by Number of Chronic Conditions, 2006. Source: Anderson, G. (2010). Chronic Care: Making the Case for Ongoing Care. Johns Hopkins University and the Robert Wood Johnson Foundation.
Chart 7.12: Percent of Medicare Fee-for-Service Spending on Chronic Conditions by Type of Service,(1) 2010 $20.0B $57.2B $86.0B $141.8B (2) (3) (4) Source: Centers for Medicare & Medicaid Services. Chronic Conditions Among Medicare Beneficiaries Chartbook 2012. Available at: http://www.cms.gov/Research-Statistics-Data-and-Systems/Statistics-Trends-and-Reports/Chronic-Conditions/Downloads/2012Chartbook.pdf. (1) Includes 15 CMS identified chronic conditions. (2) PAC = Post-acute care. (3) E&M = Evaluation & Management. (4) DME = Durable Medical Equipment. Chart added in Chartbook 2013. Replaced: Working Age Adults with Activity Limitations Due to Chronic Conditions, by Condition and Age, 2006=2007. Source: National Center for Health Statistics. (2010). Health, United States, 2009. Hyattsville, MD.
Chart 7.13: Percent Uninsured by Race, 1984 – 2012 Percent of Population Under Age 65 Source: National Center for Health Statistics. (2014). Health, United States, 2013. Hyattsville, MD. (1) Includes individuals of Hispanic and non-Hispanic origin. (2) Includes individuals of non-Hispanic origin only.
Chart 7.14: Percent of Adults with No Usual Source of Care by Race, 1993 – 2012 Percent of Adults Ages 18-64 Source: National Center for Health Statistics. (2014). Health, United States, 2013. Hyattsville, MD. (1) Includes individuals of Hispanic and non-Hispanic origin. (2) Includes individuals of non-Hispanic origin only.
Chart 7.15: Percent of Adults with No Usual Source of Care by Insurance Status, 1993 – 2012 Percent of Adults Ages 18-64 Source: National Center for Health Statistics. (2014). Health, United States, 2013. Hyattsville, MD.
Chart 7.16: Percent of Children with No Usual Source of Care by Race, 1993 – 2012 Source: National Center for Health Statistics. (2014). Health, United States, 2013. Hyattsville, MD. (1) Includes individuals of Hispanic and non-Hispanic origin. (2) Includes individuals of non-Hispanic origin only.
Chart 7.17: Percent of Children with No Usual Source of Care by Insurance Status, 1993 – 2012 Percent of Children Under 18 Years Source: National Center for Health Statistics. (2014). Health, United States, 2013. Hyattsville, MD.
Chart 7.18: Percent of Individuals with No Health Care Visits by Race, Insurance Status, 1997 and 2012 Percent of Individuals Race(1) Insurance Status Source: National Center for Health Statistics. (2014). Health, United States, 2013. Hyattsville, MD. (1) White and Black include individuals of non-Hispanic origin only. Asian includes individuals of Hispanic and non-Hispanic origin.
Chart 7.19: Percent of Children with No Health Care Visits by Race, Insurance Status, 1998 and 2012 Race (1) Insurance Status Source: National Center for Health Statistics. (2014). Health, United States, 2013. Hyattsville, MD. (1) White and Black include individuals of non-Hispanic origin only. Asian includes individuals of Hispanic and non-Hispanic origin.
Chart 7.20: Percent of Children with No Dental Visits by Race, Poverty Status, 1997 and 2012 (2) Race Poverty Status (1) Source: National Center for Health Statistics. (2014). Health, United States, 2013. Hyattsville, MD. (1) White and Black include individuals of non-Hispanic origin only. Asian includes individuals of Hispanic and non-Hispanic origin. (2) FPL = federal poverty limit.
Chart 7.21: Percent of Children Vaccinated(1) by Race, Poverty Status, 2009(2) and 2012 (4) (3) Race Poverty Status • Source: National Center for Health Statistics. (2014). Health, United States, 2013. Hyattsville, MD. • (1) Vaccinations include DTP, Polio, MMR, Hib, Hepatitis B, Varicella and PCV. • (2) Classification methodology changed for the Influenza Type B vaccine—before January 2009, NIS did not distinguish between Hib vaccine product types, so children who received three doses of the vaccine that required four doses were misclassified as fully vaccinated. • (3) White, Black and Asian include individuals of non-Hispanic origin only. • (4) FPL = federal poverty limit.
Chart 7.22: Percent of Women(1) Receiving Mammography(2) by Race, Poverty Status, 1990 and 2010 _ (4) Poverty Status Race (3) Source: National Center for Health Statistics. (2014). Health, United States, 2013. Hyattsville, MD. (1) Women over 40 years of age. (2) Indicates use of mammography in two years prior to 1990 and 2010. (3) White and Black include individuals of non-Hispanic origin only. Asian includes individuals of Hispanic and non-Hispanic origin. (4) FPL = federal poverty limit.
Chart 7.23: Percent of Adults(1) with Chronic Conditions by Insurance Type, 2007 – 2008 (2) (3) (4) Source: Agency for Healthcare Research and Quality. Center for Financing, Access, and Cost Trends. Household Component of the Medical Expenditure Panel Survey, 2007-2008. Available at: http://meps.ahrq.gov/data_files/publications/st320/stat320.shtml. (1) Includes individuals 18-64 years of age. (2) Includes individuals who had any private insurance coverage (including TRICARE) anytime between 2007 to 2008. (3) Includes individuals who had only public insurance coverage for all or part of the year between 2007 to 2008. (4) Includes individuals who were uninsured all of the year between 2007 to 2008. Chart added in Chartbook 2013.
Chart 7.24: Total Expenditures on Top 10 Most Costly Conditions Among Adults(1) by Sex, 2008 Source: Agency for Healthcare Research and Quality. Center for Financing, Access, and Cost Trends. Household Component of the Medical Expenditure Panel Survey, 2008. Available at: http://meps.ahrq.gov/mepsweb/data_files/publications/st331/stat331.shtml. (1) Only includes adults ages 18 and older. Chart added in Chartbook 2013.
Chart 7.25: 30-Day Readmission Rate for Medicare Fee-for-Service Beneficiaries by Number of Chronic Conditions,(1) 2012 Source: Centers for Medicare & Medicaid Services. Medicare Chronic Condition Dashboard. Data released June 2, 2014. Available at: https://www.ccwdata.org/web/guest/interactive-data/chronic-conditions-dashboard. (1) Includes 15 CMS identified chronic conditions. Chart added in Chartbook 2013.