Download

1 / 14
150 likes | 157 Views
Graphing inequalities in one variable. Information. Vertical regions. Inequalities can be represented by regions on a graph. A region is an area where all the points obey a given rule. Give the coordinates of three points that satisfy x ≥ 2. How would you graph the region x ≥ 2?.

E N D
Vertical regions Inequalities can be represented by regions on a graph. A region is an area where all the points obey a given rule. Give the coordinates of three points that satisfy x≥2. How would you graph the region x≥ 2? Some example coordinates are: (4, 1), (6, 5) and (3, –2). The graph needs to show the area where the x-coordinate of every point is greater than 2. When graphing inequalities, we shade the desired area. We can draw the line x = 2 and shade the region to its right.
Vertical regions We can represent all the points where the x-coordinate is equal to 2 with the line x = 2. y 5 4 The line x = 2 and the region to its right contains every point where x ≥ 2. x < 2 x ≥ 2 3 2 1 x 6 –6 –5 –4 –3 –2 –1 0 1 2 3 4 5 –1 The region to the left of the line x = 2 contains every point where x < 2. –2 –3 –4 –5
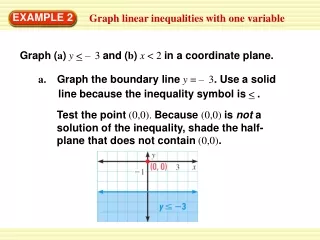
Horizontal regions How do you think we can represent the region y< 3 on a graph? The region where y< 3 does not include points where y = 3 and so we draw y = 3 as a dotted line. y 5 y> 3 The region below the line y = 3 contains every point where y< 3. 4 3 2 1 x 6 –6 –5 –4 –3 –2 –1 0 1 2 3 4 5 The region above the line y = 3 contains every point where y> 3. –1 –2 y< 3 –3 –4 –5
Horizontal and vertical regions combined y 5 4 3 2 1 x 6 –6 –5 –4 –3 –2 –1 0 1 2 3 4 5 –1 –2 –3 –4 –5 When several regions are shown on the same graph, we usually shade in the desired regions. This is so that the required area where the regions overlap can be identified; it is the darkest area. For example, to graph the region where –4 < x < –1 and –1 < y ≤ 3, • shade in the regions • x > –4 and x < –1 2) shade in the regions y > –1 and y≤ 3. The darkest region is the solution.
Summer job I can earn a maximum of $2,000 during the summer in this job. Before I start, I must prepare my bicycle to hold ice cream, which will cost me $250 at most, and take no more than two weeks. To earn money for college, James has taken a summer job selling ice cream from a bicycle at the park. Here are his notes about the time and money involved: Summer season starts on June 1st and ends on September 1st, so I have at most 3 months (12 weeks) to work. Draw a graph to help visualize James’ situation. Discuss how altering certain constraints would affect his opportunity (in time or money).