Download
1 / 51
510 likes | 674 Views
Nelson Institute for Environmental Studies Center for Climatic Research University of Wisconsin - Madison Understanding Earth’s Past, Present, and Future. Atmospheric and Oceanic Sciences University of Wisconsin - Madison. Center for Sustainability and the Global Environment (SAGE)

E N D
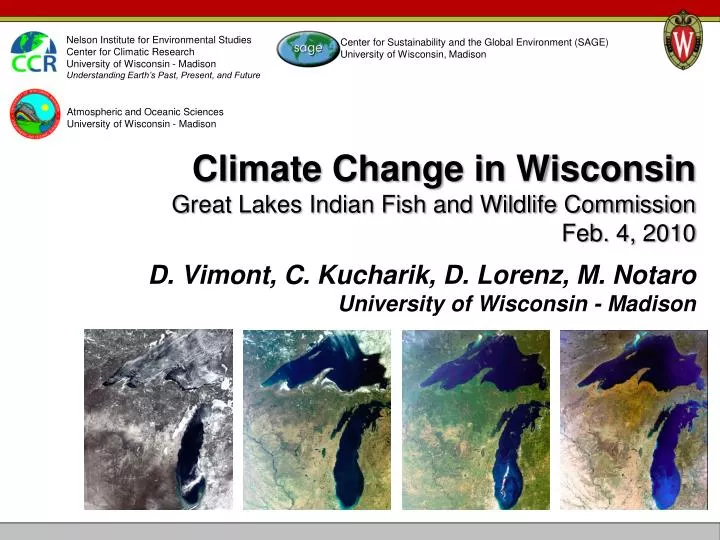
Nelson Institute for Environmental Studies Center for Climatic Research University of Wisconsin - Madison Understanding Earth’s Past, Present, and Future Atmospheric and Oceanic Sciences University of Wisconsin - Madison Center for Sustainability and the Global Environment (SAGE) University of Wisconsin, Madison Climate Change in WisconsinGreat Lakes Indian Fish and Wildlife CommissionFeb. 4, 2010D. Vimont, C. Kucharik, D. Lorenz, M. NotaroUniversity of Wisconsin - Madison
Nelson Institute for Environmental Studies Center for Climatic Research University of Wisconsin - Madison Understanding Earth’s Past, Present, and Future Atmospheric and Oceanic Sciences University of Wisconsin - Madison Center for Sustainability and the Global Environment (SAGE) University of Wisconsin, Madison Climate Change in WisconsinD. Vimont, C. Kucharik, D. Lorenz, M. NotaroUniversity of Wisconsin - Madison Thanks to:C. Kucharik (SAGE), K. Holman (CCR), S. Vavrus (CCR)Wisconsin State Climatology OfficeWisconsin Initiative on Climate Change Impacts (WICCI)Wisconsin Department of Natural ResourcesWisconsin Focus on Energy EERD Program
Outline • Global Climate Change • The Wisconsin Initiative on Climate Change Impacts (WICCI) • Motivation and Needs for Downscaled Climate Data • Results: Climate Change in Wisconsin, and ways to use the data • Conclusions and Future Directions
Outline • Global Climate Change • The Wisconsin Initiative on Climate Change Impacts (WICCI) • Motivation and Needs for Downscaled Climate Data • Results: Climate Change in Wisconsin, and ways to use the data • Conclusions and Future Directions
Global Climate Change Greenhouse Gasses: “Trap” energy in lower atmosphere Anthropogenic Greenhouse Gasses: Increasing to levels we have never seen Charles Keeling
Global Climate Change Global Temperature: Has increased by ~0.7°C over the last 100yr. The rate of increase is “accelerating”.
Global Climate Change Future Global Temperature: Temperature will increase by about 1.6°C in the next 40yr, 2°-6°C by the end of the century. Mitigation: Necessary to avoid dangerous climate change Adaptation: Climate change is inevitable; Adaptation needed to minimize impacts
Outline • Global Climate Change • The Wisconsin Initiative on Climate Change Impacts (WICCI) • Motivation and Needs for Downscaled Climate Data • Results: Climate Change in Wisconsin, and ways to use the data • Conclusions and Future Directions
Wisconsin Initiative on Climate Change Impacts WICCI: Partnership between the UW Nelson Institute for Environmental Studies, the Wisconsin DNR, and other state groups Goal: Assess and anticipate climate change impacts on specific Wisconsin natural resources, ecosystems and regions; evaluate potential effects on industry, agriculture, tourism, and other human activities; and develop and recommend adaptation strategies… http://www.wicci.wisc.edu
WICCI as a Boundary Organization WICCI: Boundary organization. Working Groups organized around “Boundary Objects”.
WICCI Working Groups Human Health Milwaukee Water Resources Coldwater Fish Soil Conservation Stormwater Agriculture Wisconsin Climate Wildlife Adaptation Green Bay Plants & Natural Communities Coastal Communities Central Sands Hydrology Forestry
Outline • Global Climate Change • The Wisconsin Initiative on Climate Change Impacts (WICCI) • Motivation and Needs for Downscaled Climate Data • Results: Climate Change in Wisconsin, and ways to use the data • Conclusions and Future Directions
Global Climate Change Future Climate Change: How do we know what will happen? Global Climate Models Divide the world into boxes, solve equations that govern weather / climate on a discrete grid. Apply forcing based on a “storyline” of future emissions
Global Climate Change Moving from Global to Regional Problem: Models are meant to reliably simulate GLOBAL climate. What regional changes can we trust? How do we translate global change into a regional context? What physical phenomena are missing?
Global Climate Change Thanks to D. Lorenz Downscaling: Focus global projections to a scale relevant to climate impacts. WICCI Climate Working Group / Focus on Energy
Needs for Downscaled Data Characterize Uncertainty Uncertainty from: large-scale model physics, emissions scenario, transition from large to small scale, additional uncertainty (from subjective assessment) High resolution (spatial and temporal) 8-10km resolution, daily time scale Need to represent extremes Extreme precipitation is necessary for hydrology; extreme temperature for human health / forestry / others FLEXIBILITY!!! Numerous potential applications, so flexibility is needed!
Global Climate Change Thanks to D. Lorenz Downscaling: Focus global projections to a scale relevant to climate impacts. WICCI Climate Working Group / Focus on Energy
Downscaled Data (first order): Greenhouse Gas Emissions Scenarios: 20c3m, sresb1, sresa1b, sresa2 Models: 15 climate models contributing daily data to the IPCC / CMIP3 model archive Realizations: 3 realizations per model to better resolve extreme events Time Periods: 1960-1999, 2046-2065, 2081-2100 Total: 100Gb of data available, much more is possible (this will expand as more model data / needs emerges)
Outline • Global Climate Change • The Wisconsin Initiative on Climate Change Impacts (WICCI) • Motivation and Needs for Downscaled Climate Data • Results: Climate Change in Wisconsin, and ways to use the data • Conclusions and Future Directions
Annual Temperature Change Mean Temperature will warm by 4-9 oF by mid-century
Annual Temperature Change Probabilistic Approach: More useful for planning
Annual Temperature Change Winter Temperature will warm by 5-11 oF by mid-century
Annual Temperature Change Winter Temperature will warm by 5-11 oF by mid-century
Annual Temperature Change Summer Temperature will warm by 3-8 oF by mid-century
Annual Temperature Change Summer Temperature will warm by 3-8 oF by mid-century
Intense Precipitation Events Intense precipitation events become more common in winter / spring
Intense Precipitation Events Intense precipitation events become more common in winter / spring
Snow (M. Notaro) Downscaled data are used to estimate other parameters of relevance to impact assessments (e.g. annual snowfall)
Snowfall changes – 2055 conditions A2 Scenario: Snowfall Changes % Change Snowfall is reduced by 20-30% by mid-century. This translates to 30-50% decrease in midwinter snow depth
Snowfall changes – 2055 conditions Snow season shortens by 1 to 1½ months
Ways to use the data: Classic Risk Assessment Use actual probability distributions to identify Risk as the product of probability and consequence Spatio-temporal Data Generate spatial data using a “weather generator” type noise pattern. 3. Historical Rescaling Rescale an existing time series from a present-day PDF to a future PDF.
Climate Change and Risk: Risk: Probability of an event occurring times its consequence Mitigation: Intervention to reduce the sources of greenhouse gases or enhance their sinks Adaptation: Adjustment of a system to moderate potential damages, to take advantage of opportunities, or to cope with consequences, associated with climate change
Present Climate Predicted Climate Impact threshold Probability Climate Space Actual Probability Distributions • Risk Assessment: • Identify threshold / response surface • Define present day risk with present day probability distribution • Compare future risk with future probability distribution • Explore how adaptation strategies can impact risk Adaption Probability Climate Space
Present Climate Probability MaxT (e.g.) Rescale a historical time series • Why to use this approach: • You’ve already done some analysis with historical weather data • Impact is “event-like” • Covariates are important (e.g. warm, wet, and windy on a given day) • Policy decisions can be compared to historical decisions Probability MaxT (e.g.)
Outline • Global Climate Change • The Wisconsin Initiative on Climate Change Impacts (WICCI) • Motivation and Needs for Downscaled Climate Data • Results: Climate Change in Wisconsin, and ways to use the data • Conclusions and Future Directions
Climate Change Impacts in Wisconsin Downscaling Climate over Wisconsin Downscaled projections of precipitation and maximum and minimum temperature for Wisconsin have been completed. The downscaling methodology predicts the (daily) probability distribution for a specific station based on large scale inputs. The advantages of the downscaling technique include (a) it works well (b) interpolation of distribution parameters avoids bias in extremes or discrete events (c) uncertainty is characterized across various dimensions (d) the resulting data are very flexible
Conclusions: • WICCI has available one of the most comprehensive and flexible (i.e. useful for assessing impacts of climate change) regionally downscaled climate data sets in the world. • Major findings include: • Wisconsin will warm by 4°-9°F by mid-21st century • Mean winter precipitation will increase by 0%-40% by mid-21st century • Extreme precipitation events will intensify by mid-21stcentury, especially during winter, spring, and fall. • Winter snowfall and snow cover will be significantly reduced by mid-21st century.
Future Directions: • Temporal Sequencing (duration of drought, duration of extreme temperature events, etc.): • Work is underway. Downscaled data looks reasonable. • Wind (EERD 2010-2012): • Important for: Energy, forestry, lake circulation, etc. • Methodology: Extend existing Generalized Linear Model to a multivariate probability distribution. • Evapotranspiration (EERD 2010-2012): • Important for: lakes, hydrology, forestry, wildlife, lake biology (and health impacts), etc. • Methodolgy: Use wind / precipitation / temperature results in a regional land surface model • 4. Solar radiation / cloud cover (EERD 2010-2012): • This one will be tricky, and may not be reliable. But we won’t know until we try.
Wisconsin Initiative on Climate Change Impacts WICCI: Partnership between the UW Nelson Institute for Environmental Studies, the Wisconsin DNR, and other state groups Goal: Assess and anticipate climate change impacts on specific Wisconsin natural resources, ecosystems and regions; evaluate potential effects on industry, agriculture, tourism, and other human activities; and develop and recommend adaptation strategies… http://www.wicci.wisc.edu
Resources: Wisconsin Initiative on Climate Change Impacts http://www.wicci.wisc.edu Climate Working Group Interactive Website http://ccr.aos.wisc.edu/cwg/ UW Atmospheric and Oceanic Sciences http://www.aos.wisc.edu Nelson Institute for Environmental Studies http://www.nelson.wisc.edu Center for Climatic Research http://ccr.aos.wisc.edu Center for Sustainability and the Global Environment http://www.sage.wisc.edu Intergovernmental Panel on Climate Change http://www.ipcc.ch
Image Sources: • Mauna Loa CO2 curve: Image created by Robert A. Rohde / Global Warming Art, http://www.globalwarmingart.com/wiki/File:Mauna_Loa_Carbon_Dioxide_png • Charles Keeling Image: c/o Scripps Institution for Oceanography, http://sio.ucsd.edu/keeling/ • Historical and future temperature change and Greenhouse Effect: IPCC WG1, http://ipcc-wg1.ucar.edu/ • Climate Model Schematic: http://www.iac.ethz.ch/groups/knutti/research • June, 2008 Flood Event: Midwest Regional Climate Center, http://www.crh.noaa.gov/mkx/?n=jun08_flooding