Download
1 / 22
220 likes | 320 Views
Intelligent Environment For Water Level Maintenance. ECE 445 : Senior Design Project Spring 2005, Group #15. Group Members : Abhinav Gupta Dhruv Dhanda Nirmal Gokarn. Teaching Assistant Mentor : Chad Carlson . The Idea. The Idea of this project is:

E N D
Intelligent Environment For Water Level Maintenance ECE 445 : Senior Design Project Spring 2005, Group #15 Group Members: Abhinav Gupta Dhruv Dhanda Nirmal Gokarn Teaching Assistant Mentor : Chad Carlson
The Idea • The Idea of this project is: • There are multiple tanks that need to have a minimum amount of water all the time. • There is only one pump available for use. • Tanks have different priorities among themselves. • The minimum and maximum water levels should be user defined.
Original Design • We started with a design with the following features: • Each tank had three electrodes, a reference electrode, a lower level detection electrode and a higher level detection electrode. • Electrodes were used to only detect whether the circuit was complete or broken. • PIC16F877A was used to receive inputs from the electrodes and controlled the switching of the pump and the valves. • Two tanks were proposed to show the non priority operation. • We proposed to use the comparator on the PIC to determine whether the electrode input was greater than 2V or not.
Original Design The original circuit diagram we proposed was the following:
Adding Priority • This was the first change we made. We introduced priorities among various tanks. Priorities are as follows: • One set of tanks has a drought priority, from a highest priority to a lowest priority to a lowest priority tank. • The remaining tanks have a set of tanks with flood priorities, from highest priority to a lowest priority. • The remaining set of tanks have equal priorities.
Using Only Two Electrodes We made a big design change by using a single electrode instead of two electrodes to detect lower and higher water levels. As the water levels change so does the resistance between the two electrodes. Thus the voltage drop across the electrode changes with the change in water levels. We use the A-to-D converter on the PIC to detect changes in the water levels.
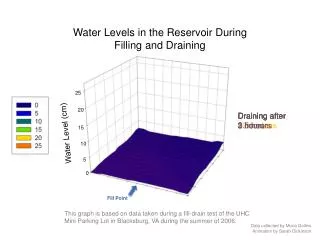
The Voltage across the electrodes changes as the volume (height) of the water changes. The following plot shows the variation:
From this plot we realize the following: The voltage level varies significantly in the beginning and then it reaches a saturation. To use a single electrode to detect a two different water levels or to use dynamic control we need to be in a region far from the saturation point. This is feasible only in small tanks since in larger tanks large volumes correspond to a very small change in height.
Solution: To solve this problem we need to use thicker electrodes but this is not cost feasible as the cost of an electrode depends on the volume of tungsten and thus the cost increases quadratically with the electrode diameter. The other alternative is to use two electrodes instead, one at lower level and other at higher level as we suggested earlier. These electrodes can provide a small amount of dynamic control over the water level thresholds. Note: This problem is not related to tungsten but is common to any metal. We tested the system with copper and aluminum electrodes and the same trend was found.
Successes and Problems encountered The project was demonstrated successfully, albeit at the second go. During the initial demo, we had a misplaced low pass filter and thus the noise signals were causing Random fluctuations in the logic. We showed priority testing in tanks, as we had proposed to do. In this way, we can set Priority functionality to the project. We added dynamic control of the thresholds using a single electrode, which was not Even part of our initial proposal idea. This we achieved using analog voltage signals The electrode and then converting it using an A/D converter. In this sense, we exceeded Our proposal idea, something that we are proud of. We successfully tested out the project under a host of conditions, including water sample Tests, noise tests, distance tests, height vs. voltage tests and hence ensured a robust Working model. We defined minimum and maximum limits for a variety parameters, including noise, Minimum level detection, etc.
TestingProcedures We understand that testing for accuracy and reliability of the project depends upon Defining limits for each of the components. We conducted such tests extensively, so as to completely set define thresholds for Each part. Since noise was an adversary we had to deal with all time, most of our tests revolved Around maneuvering noise and controlling it. The first test that we performed was to check how the valve and pump reacted to Varying voltage and frequency changes. We found out that the valve behaved in a very Stable manner in the frequency range of 30-95 Hz, although it was best centered Around 60 Hz. Similarly, it reacted fairly in a uniform manner to RMS voltage levels of 11-27 V, Since it performed best at a voltage of 24 V, we used a 120/24 Volt Transformer to run it. The same was conducted for the pump, which behaved arbitrarily for voltage changes, So we decided to run it straight from the power bench, through a 120 V, 60 Hz supply.
Noisetesting- from the pump The pump that we used is a huge induction motor, and we had to spend an Overwhelmingly large amount of time in trying to isolate this from the rest of the System as it was interfering with the board and the relays. First we tried using Faraday’s law in trying to isolate the pump. Using the method of Faraday’s cage, we wrapped Aluminum foil to shield the system. This failed as the Shielding required was far greater and we could not get hold of a thicker sheet of metal. Next we tried to implement a low pass filter, since we thought that the noise was being Generated through the relay, instead it was being generated at the Proto-board itself. This Also failed since we could not compensate for the large spikes that were found Due to this noise. We also tried a notch filter to eliminate noise at 60 Hz, but this failed too. We tried an AND gate to separate signals, which was unsuccessful too. We implemented a voltage follower to do the same, but again we ran into the same Problem.
Noise in the circuit and how we deal with it • There are two kinds of noise that we had to deal with: • a) Noise from the pump (induction motor) which interfered with our logic by sending large spike signals • b) Noise from the electrodes, which gave us the analog output w.r.t the reference signal that we provide. • The second signal was easy to deal with, it remained constant with distance, having a 192 mV noise, which was primarily high frequency in nature. • We solved this problem using a low pass filter, which effectively dealt with the problem. Successively modifying this filter could improve results even further.
Noise rejection vs. Distance • The plot shows that the distance of isolation varies as an inverse quadratic to the noise amplitude. We plotted a peak-peak noise signal vs. the distance, and obtained the following plot.
Solution to Noise rejection from Pump • Eventually when everything else, failed, we tried isolating the mechanical and the electrical systems far away from each other. • The previously attached graph shows the variation of the distance and the noise. • At a distance of 30 feet or more, the noise rejection was good enough to compensate proper working. • This might not be the best solution, but it is a practical alternative to expensive solutions that can be found out. This is practical as in any system, the mechanical system (hoses, pump, valves, tanks) will be isolated from the electrical system (relays, transformer, proto-board, PIC, wiring)
Time lag in the electrical system • Next we tested the time delay in the electrical system, this meant the time taken from the electrode sending the signal, to the time the relay of the pump sent out an output. • We tested this, using the difference in priorities of the two tanks. • If both tanks were below minimum thresholds, then the time delay would correspond to the time lag in filling up the first tank, and starting the non-priority one. • We conducted three trials of this experiment, and found out that the maximum lag in the electrical system was 109 ms. • The time lag in the mechanical system was somewhat more varied, ranging from 5 s to 13 s, for no apparent change in conditions. This is probably due to the pump starting and stalling times, but even at a maximum of 13.1 s, the system responds without a considerable lag.
Water salinity vs. Electrode potential • Theoretically, for a strong electrolyte like NaCl, the conductivity varies as the square root of the molar concentration. • We started with distilled water, and successively added approx. 150 mg of salt every iteration. We found out the quadratic nature of this sampling, which the plot shows in the next slide. • Approximating a best fit function from MATLAB, we found a near quadratic nature as we expected. • The weights of the salt samples have 0.1 mg accuracy, and the voltage levels have a 0.01 V accuracy.
Water salinity plot vs. Voltage across electrode • The following is the water salinity graph plotted against potential drop across electrode.
Best fit graph of salinity vs. Voltage drop across electrodes • We plotted the best fit graph of the salinity vs. Voltage which is shown here:
Recommendation • The model is built in such a way that the components can be easily scaled for industrial purposes. • The water can be replaced with other conducting fluid as per the requirements of the designer. • The overall circuit can be marketed as a single module to ease circuit connections and portability. • Due to the linear relationship between the electrode and the water levels, tank sizes should be of smaller diameter to obtain good voltage signals from the electrode.