Download
1 / 1
10 likes | 102 Views
THEME: WATER/ENVIRONMENT. The stoichiometry of uptake: dual nutrient uptake kinetics from ambient to saturation. Leslie R. Piper, Brian L. McGlynn , and Wyatt F. Cross. Montana State University, Bozeman, MT leslie.piper@msu.montana.edu. Introduction. Results. Dual-nutrient uptake regimes.

E N D
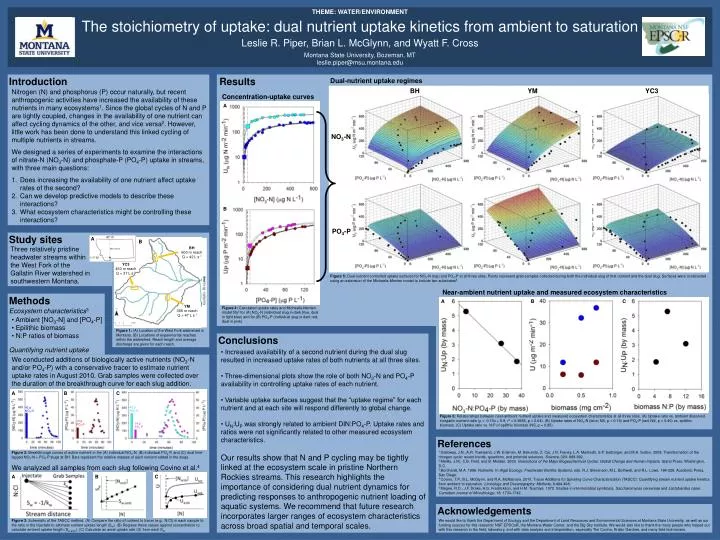
THEME: WATER/ENVIRONMENT The stoichiometry of uptake: dual nutrient uptake kinetics from ambient to saturation Leslie R. Piper, Brian L. McGlynn, and Wyatt F. Cross Montana State University, Bozeman, MT leslie.piper@msu.montana.edu Introduction Results Dual-nutrient uptake regimes BH YM YC3 Nitrogen (N) and phosphorus (P) occur naturally, but recent anthropogenic activities have increased the availability of these nutrients in many ecosystems1. Since the global cycles of N and P are tightly coupled, changes in the availability of one nutrient can affect cycling dynamics of the other, and vice versa2. However, little work has been done to understand this linked cycling of multiple nutrients in streams. We designed a series of experiments to examine the interactions of nitrate-N (NO3-N) and phosphate-P (PO4-P) uptake in streams, with three main questions: Does increasing the availability of one nutrient affect uptake rates of the second? Can we develop predictive models to describe these interactions? What ecosystem characteristics might be controlling these interactions? Concentration-uptake curves A NO3-N B PO4-P Study sites A B Three relatively pristine headwater streams within the West Fork of the Gallatin River watershed in southwestern Montana. BH 600 m reach Q = 42 L s-1 YC3 450 m reach Q = 37 L s-1 Figure 5: Dual-nutrient controlled uptake surfaces for NO3-N (top) and PO4-P at all three sites. Points represent grab samples collected during both the individual slug of that nutrient and the dual slug. Surfaces were constructed using an extension of the Michaelis-Menten model to include two substrates5. Near-ambient nutrient uptake and measured ecosystem characteristics Gallatin River Methods A B C YM 366 m reach Q = 47 L s-1 Figure 4: Calculated uptake rates and Michaelis-Menten model fits3 for (A) NO3-N (individual slug in dark blue, dual in light blue) and for (B) PO4-P (individual slug in dark red, dual in pink). Ecosystem characteristics3 • Ambient [NO3-N] and [PO4-P] • Epilithic biomass • N:P ratios of biomass Figure 1: (A) Location of the West Fork watershed in Montana. (B) Locations of experimental reaches within the watershed. Reach length and average discharge are given for each reach. Conclusions Quantifying nutrient uptake • Increased availability of a second nutrient during the dual slug resulted in increased uptake rates of both nutrients at all three sites. • Three-dimensional plots show the role of both NO3-N and PO4-P availability in controlling uptake rates of each nutrient. • Variable uptake surfaces suggest that the “uptake regime” for each nutrient and at each site will respond differently to global change. • UN:UP was strongly related to ambient DIN:PO4-P. Uptake rates and ratios were not significantly related to other measured ecosystem characteristics. We conducted additions of biologically active nutrients (NO3-N and/or PO4-P) with a conservative tracer to estimate nutrient uptake rates in August 2010. Grab samples were collected over the duration of the breakthrough curve for each slug addition. A B C Figure 6: Relationships between near-ambient nutrient uptake and measured ecosystem characteristics at all three sites. (A) Uptake ratio vs. ambient dissolved inorganic nutrient ratio (y = -0.10x + 5.8, r2 = 0.9965, p = 0.04). (B) Uptake rates of NO3-N (blue; NS, p = 0.19) and PO4-P (red; NS, p = 0.40) vs. epilithic biomass. (C) Uptake ratio vs. N:P of epilithic biomass (NS, p = 0.85). 42 g NO3-N 42 g NO3-N 14 g PO4-P 14 g PO4-P References 1 Galloway, J.N., A.R. Townsend, J.W. Erisman, M. Bekunda, Z. Cai, J.R. Freney, L.A. Martinelli, S.P. Seitzinger, and M.A. Sutton. 2008. Transformation of the nitrogen cycle: recent trends, questions, and potential solutions. Science, 320: 889-892. 2 Melillo, J.M., C.B. Field, and B. Moldan. 2003. Interactions of the Major Biogeochemical Cycles: Global Change and Human Impacts. Island Press, Washington, D.C. 3 Borchardt, M.A. 1996. Nutrients. In Algal Ecology: Freshwater Benthic Systems, eds. R.J. Stevenson, M.L. Bothwell, and R.L. Lowe, 184-228. Academic Press, San Diego. 4 Covino, T.P., B.L. McGlynn, and R.A. McNamara. 2010. Tracer Additions for Spiraling Curve Characterization (TASCC): Quantifying stream nutrient uptake kinetics from ambient to saturation. Limnology and Oceanography: Methods, 8:484-498. 5 Megee, R.D., J.F. Drake, A.G. Fredrickson, and H.M. Tsuchiya. 1972. Studies in intermicrobial symbiosis, Saccharomycescerevisiae and Lactobacillus casei. Canadian Journal of Microbiology, 18: 1733-1742. Figure 2: Breakthrough curves of active nutrient in the (A) individual NO3-N, (B) individual PO4-P, and (C) dual time-lagged NO3-N + PO4-P slugs at BH. Bars represent the relative masses of each nutrient added in the slugs. Our results show that N and P cycling may be tightly linked at the ecosystem scale in pristine Northern Rockies streams. This research highlights the importance of considering dual nutrient dynamics for predicting responses to anthropogenic nutrient loading of aquatic systems. We recommend that future research incorporates larger ranges of ecosystem characteristics across broad spatial and temporal scales. We analyzed all samples from each slug following Covino et al.4 A B C Acknowledgements Figure 3: Schematic of the TASCC method. (A) Compare the ratio of nutrient to tracer (e.g., N:Cl) in each sample to the ratio in the injectate to estimate nutrient uptake length (Sw). (B) Regress these values against concentration to calculate ambent uptake length (Sw-amb). (C) Calculate an areal uptake rate (U) from each Sw. We would like to thank the Department of Ecology and the Department of Land Resources and Environmental Sciences at Montana State University, as well as our funding sources for this research: NSF EPSCoR, the Montana Water Center, and the Big Sky Institute. We would also like to thank the many people who helped out with this research in the field, laboratory, and with data analysis and interpretation, especially Tim Covino, Kristin Gardner, and many field technicians.