Download
1 / 7
70 likes | 184 Views
B. 3.5. VEGF. 3.0. 2.5. 2.0. VEGF/HPRT (fold induction). 1.5. 1.0. 0.5. 0.0. 0. 1. 2. 3. 4. 5. 6. Time (h). 6. Tis11b. 5. HuR. 4. Tis11b/HPRT or HuR/HPRT (fold induction). 3. 2. 1. 0. 0. 1. 2. 3. 4. 5. 6. Time (h). A. 462 bp (VEGF 165 ). VEGF.

E N D
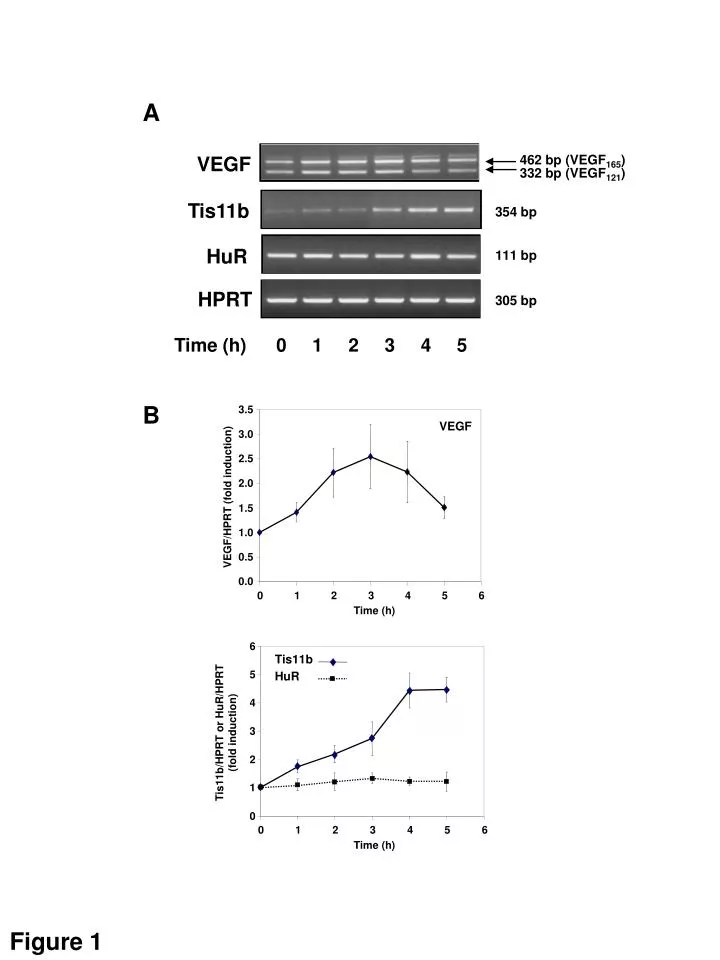
B 3.5 VEGF 3.0 2.5 2.0 VEGF/HPRT (fold induction) 1.5 1.0 0.5 0.0 0 1 2 3 4 5 6 Time (h) 6 Tis11b 5 HuR 4 Tis11b/HPRT or HuR/HPRT (fold induction) 3 2 1 0 0 1 2 3 4 5 6 Time (h) A 462 bp (VEGF165) VEGF 332 bp (VEGF121) Tis11b 354 bp HuR 111 bp HPRT 305 bp Time (h) 0 1 2 3 4 5 Figure 1
A B Total cell extracts 0.50 0.45 HuR 0.40 0.35 Tis11b 0.30 Tis11b/tubulin or HuR/tubulin 0.25 0.20 Tis11b a-tubulin HuR 0.15 Time (h) 0 1 2 3 4 5 6 0.10 0 1 2 3 4 5 6 7 Time (h) C D Cytoplasm (20 µg) Nuclei (5 µg) 90000 HuR 80000 70000 Nuclei 60000 Tis11b 50000 HuR protein / cytoplasmic or nuclear total protein (arbitrary density units) 40000 a-tubulin 30000 Cytoplasm 20000 Lamin A/C 10000 0 0 1 2 3 4 5 6 7 Time (h) 0 0.5 124 6 0 0.5 124 6 Time (h) Figure 2
A Cytoplasm HuR IgG light chain pp32 IgG light chain Time (h) 0 1234 Nuclei HuR B 35000 IgG light chain Cytoplasm Nuclei 30000 Time (h) 0 1234 25000 HuR protein levels (arbitrary density units) 20000 15000 10000 0 1 2 3 4 5 Time (h) Figure 3
A - LMB + LMB HuR Cytoplasm a-tubulin Lamin A/C HuR Nuclei Lamin A/C a-tubulin Time (h) 0 0.5 1234 Time (h) 0 0.5 1234 B - LMB + LMB VEGF165 VEGF VEGF121 HPRT Time (h) 0 0.5 1234 0 0.5 1234 4.0 ACTH 3.5 ACTH+LMB 3.0 2.5 VEGF/HPRT (fold induction) 2.0 1.5 1.0 0.5 0.0 0 1 2 3 4 Time (h) C Figure 4
A Negative control siRNA + siRNA HuR HuR VEGF121 VEGF165 VEGF HPRT Time (h) 0 1 2 3 4 5 6 9 0 1 2 3 4 5 6 9 B Negative control siRNA + siRNA HuR HuR a-tubulin Time (h) 0 0.5 1 2 3 4 5 6 0 0.5 1 2 3 4 5 6 250 ACTH - siRNA 225 ACTH + siRNA 200 175 150 VEGF/HPRT (% of control) 125 100 75 50 25 0 0 1 2 3 4 5 6 7 8 9 10 Time (h) C Figure 5
A B 0.55 ** 0.50 0.40 0.45 0.40 0.35 0.35 0.30 0.30 Firefly Luc/Renilla Luc 0.25 0.25 ** 0.20 ** Firefly Luc/Renilla Luc 0.20 0.15 *** 0.10 0.15 0.05 0.10 0 0 0.05 0.1 0.5 1 0.05 HuR (ng) 0 0 0.1 0.5 1 5 Tis11b (ng) C D *** ** ** 180 * +++ Luciferase 160 + 140 120 + 100 18S Firefly Luc/Renilla (% of Control) 80 +++ 60 HuR (ng) Tis11b (ng) 0 0.1 0.1 0.1 - - 0 - 0.2 1 0.2 1 40 20 0 HuR (ng) Tis11b (ng) 0 0.05 0.1 - - 0.1 0.1 0 - - 0.2 1 0.2 1 HuR Tis11b Figure 6
A SmaI StuI StyI AflII NsiI 1 198 862 1081 1255 1828 2201 5’ 3’ FL B µg Tis11b 0 2 0 2 4 6 µg HuR 0 0 1 2 5 1 ns 64.2 kDa GST-HuR Tis11b 37.1 kDa 25.9 kDa 1 2 3 4 5 6 7 8 9 3’UTR FL* RNA C 125 100 Tis11b 75 % of binding 50 25 HuR 0 0 1 2 3 4 5 6 HuR or Tis11b (µg) Figure 7