Download
1 / 45
460 likes | 676 Views
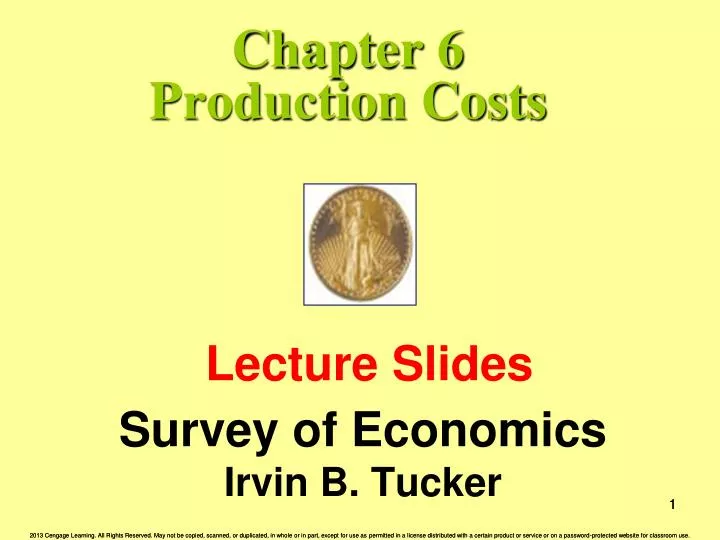
Chapter 6 Production Costs. Survey of Economics Irvin B. Tucker. Lecture Slides. 1. What is the purpose of this chapter?. The purpose of this chapter is to study production and its relationship to various types of costs. 2. What is a basic assumption in economics?.

E N D
Chapter 6Production Costs Survey of EconomicsIrvin B. Tucker Lecture Slides 1
What is the purpose of this chapter? • The purpose of this chapter is to study production and its relationship to various types of costs 2
What is a basic assumption in economics? • The motivation for business decisions is profit maximization 3
To understand profit, what is necessary? • To distinguish between the way economists measure costs and the way accountants measure costs 4
What are explicit costs? • Payments to nonowners of a firm for their resources 5
What are implicit costs? • The opportunity costs of using resources owned by the firm 6
What is an example of implicit costs? • When a firm uses its own resources, such as the owner’s labor, land, building, or savings, the firm gives up the opportunity of earning a return on its resources. 7
What are total opportunity costs? Explicit costs + Implicit costs 8
What iseconomic profit? • Total revenue minus explicit and implicit costs, or total revenue minus total opportunity costs 9
What is normal profit? • The minimum profit necessary to keep a firm in operation 10
What about opportunity cost? • A firm that earns normal profits earns total revenue equal to its total opportunity cost 11
How is accounting profit defined? • Total revenue minus total explicit costs 12
6.1 13
What conclusion can we make? • Since business decision making is based on economic profit, rather than accounting profit, the word profit in this text always means economic profit 14
What is a fixed input? • Any resource for which the quantity cannot change during the period of time under consideration 15
What is avariable input? • Any resource for which the quantity can change during the period of time under consideration 16
What is the short run? • A period of time so short that there is at least one fixed input 17
What is the long run? • A period of time so long that all inputs are variable 18
What is theproduction function? • The relationship between the maximum amounts of outputs a firm can produce and various quantities of inputs 19
What do technological advances make possible? • More output is possible from a given quantity of inputs 20
What ismarginal product? • The change in total output produced by adding one unit of a variable input, with all other inputs used held constant 21
What is the law of diminishing returns? • The principle that beyond some point the marginal productdecreases as additional units of a variable resource are added to a fixed factor 22
What does the law of diminishing returns assume? • Fixed inputs; it is therefore a short-run concept 23
Exhibit 6.2 (a) Total Output Curve Curve 60 50 40 (bushels of grapes per day) 30 Total Product Total Output 20 10 0 3 1 2 6 4 5 Quantity of labor 25 (number of workers per day)
Exhibit 6.2(b) Marginal Product Curve 12 10 8 Marginal Product 6 (bushels of grapes per day) Marginal Product Law of Diminishing Returns 4 2 0 1 6 2 3 4 5 Quantity of labor 26 (number of workers per day)
What istotal fixed cost? • Costs that do not vary as output varies and that must be paid even if output is zero. For example, rent, interest on loans, and property taxes. 27
What istotal variable cost? • Costs that are zero when output is zero and vary as output varies. Examples are wages, electricity, fuel, and materials. 28
What is total cost? • The sum of total fixed costand total variable costat each level of output TC = TFC + TVC 29
What isaverage fixed cost? • Total fixed cost divided by the quantity of output produced AFC = TFC / Q 30
What is average variable cost? • Total variable cost divided by the quantity of output produced AVC = TVC / Q 31
What isaverage total cost? • Total costdivided by the quantity of output produced. Also called per-unit cost. ATC = TC/Q OR ATC=AFC +AVC 32
What is marginal cost? • The change in total cost when one unit of output is produced MC = TC/Q 33
6.3 34
Exhibit 6.4(a) Short-RunCost Curves TC 800 700 TVC 600 500 Total Costs (dollars) TFC 400 300 TFC 200 100 0 2 6 8 10 12 4 Quantity of output (units per hour) 35
Exhibit 6.4(b) Short-Run Cost Curves 160 140 MC 120 100 Cost per unit (dollars) 80 ATC 60 AVC AFC 40 20 AFC 0 4 2 8 12 6 10 Quantity of output(units per hour) 36
6.5 37
What is the long-run average cost curve? • The curve that traces the lowest cost per unit at which a firm can produce any level of output when the firm can build any desired plant size 38
Exhibit 6.6 The Relationship Between Three Factory Sizes and the Long-Run Average Cost Curves SRATCs SRATCm SRATCl 50 Cost per unit (dollars) B D 40 LRAC 30 C A 20 10 0 12 14 16 6 8 10 2 4 Quantity of output (units per hour) 39
Exhibit 6.7 Long-run Average Cost Curves Short-run average total cost curves 12 10 Cost per unit (dollars) 8 6 4 2 Long-run average cost curve 0 6 12 16 2 4 10 14 8 Quantity of output (units per hour) 40
What areeconomies of scale? • A situation in which the long-run average cost curvedeclines as the firm increases output 41
What are constant returns to scale? • A situation in which the long-run average cost curve does not change as the firm increases output 42
What arediseconomies of scale? • A situation in which the long-run average cost curve rises as the firm increases output 43
Exhibit 6.8 Long-run Average Cost Curve LRAC Cost per unit (dollars) Diseconomies of scale Constant returns to scale Economies of scale 0 Q2 Q1 Quantity of output 44
END 45