Download
1 / 25
250 likes | 254 Views
Learn about non-parametric tests for comparing groups, including Wilcoxon's Signed-rank, Wilcoxon Rank-sum, and Permutation Theory. Understand their assumptions, how they work, and when to use them.

E N D
Non-parametric Tests • You now know about comparing means using the z or t distributions. Those are both theoretical distributions that depend on your data being approximately normally distributed. You can lean on the CLT to help you get a normally distributed sampling distribution but there are times when your sample is small and you strongly suspect the data (and more importantly, the sampling distribution) are not normally distributed.
Wilcoxon’s Signed-rank • It parallels the one sample t-test. • It is frequently done on the difference between two scores and you want to see if the data is different from zero. • Rank the absolute scores from lowest to highest. Call the lowest person 1, the 2nd lowest 2, etc. Add up the rank scores for the people below 0 (call that total R-) and add up the rank scores for the people above 0 (call that total R+).
How Signed Rank Works • You use the ranks rather than the original values and get an approximate t score and test it against the t distribution.
Example Wilcoxon Signed Rank • See nonParametric.egp
Assumptions • The Signed Rank test makes the assumption that the observations are independent and the data’s distribution is approximately symmetrical. If you can’t say the data is symmetrical, there is another non-parametric alternative: the sign test. • If the data really are normally distributed and you are interested in comparing means, the t-test is more powerful and should be used.
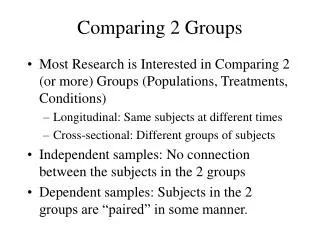
Wilcoxon Rank-sum (aka Mann-Whitney U) • It is like the two sample t-test. It, like the t-test, assumes that observations are independent (e.g., different people) but it does not assume the data are approximately normally distributed. • It is often applied to Likert scale data. • Instead of using the original scaled scores, you convert the data to ranks (from low to high) and look to see if the average ranks are different between the two groups.
How it Works • R1 sum of the ranks for the first group. • R2 sum of the ranks for the second group. Expected rank if half were from each group Tweak this formula slightly if lots of ties
Other Nonparametric Methods • These methods are considered non-parametric because they are playing with the rank orders and you are not directly appealing to the data being described by a couple of parameters (the mean and SD typically). There are truly nonparametric methods for testing for differences between groups.
Permutation Theory… • If you collect scores (data) from two groups, at the end of the day you will have two columns. One column indicates group membership and the other has the scores. You can get the sum of the scores (or any other statistic) for the two groups. • Then shuffle the scores around randomly (across both groups) and recalculate the sums (statistics). You can then do this a LOT of times (or until you have done all the possible reshufflings – every permutation). After doing this many times you then look to see how unusual your original total is relative to the possible scores you saw with the permutations. The percentile rank gives you a p-value to say how odd your data is.
In the beginning…. • Back in the beginning of time, I talked about modeling. • You want to make a prediction about a group’s outcome given one or more predictors. • Think about group membership as a model. • If you are in a baseline group, you get assigned one mean and if you are in another group, you add or subtract relative to the baseline.
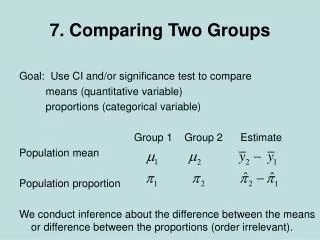
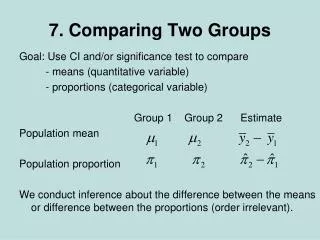
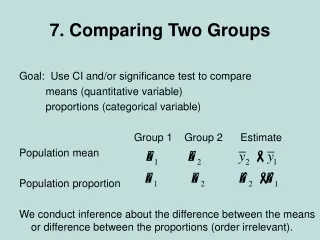
T-Test as a Model • Last week I talked about building a model where you are modeling the mean score for a group or a difference between groups. Predicting the means extends naturally to comparing more than 1 group.
T-test as a Model • I am making a prediction about the outcome mean. Do I want to use the overall mean or will I do “better” if I call one level the baseline mean and then add something to it to represent the other mean? I will naturally test to see if that amount of difference could happen by chance alone.
T as a Model Score as 1 or 0 if you are in the other group.
ANOVA as a Model • Exactly the same logic extends to comparing 3 or more groups. You have a baseline level and then you add (or subtract) something from the mean if you are not in the reference group. As I mentioned, the statistical method to see whether the amount of difference is meaningful is strange because it is based on variances.
Reduced Variance • With the T or Z distributions you got excited if your sample mean was far from the proposed null population mean. Here, you get excited if the ratio of the two variances is far from 1. You need a distribution that can describe the ratio of two variances. That distribution is the F. It has a parameter to describe the number of subjects in the two halves of the fraction.
Decomposition of Variance • The way the result of an ANOVA is typically shown is the variance within groups relative to the variance between groups.
One-way ANOVA • If your model has one categorical predictor variable, it is called a one-way ANOVA. • You will do an ANOVA to test the global hypothesis that the means of the groups are the same. • A statistically significant ANOVA only tells you some mean is different from some other mean (a statistically significant ANOVA does mean that all means are different from each other – although that rarely happens). • If this omnibus test says there is a difference between the means, you will then do tests to see which mean is different.
Before You do ANOVA • You assume the subjects are randomly selected from (or representative of) a large population. • The samples are obtained independently. If your subjects were not independent or if you measure the same person repeatedly, you will want to use ANOVAs specially designed for repeated measures or more complicated statistics. • As with a t-test, you assume that the population is approximately normally distributed (or you have a large sample).
Why bother learning this? • Why not just do a pile of t-tests first? • Multiple comparisons: • Your experiment-wise error is not .05, it is closer to p ≈ 1-.95numberOfComparisons • Pooled standard errors: • You want to make the best possible estimate of the variability in the population (SEs). Therefore you want to combine the information across the different subgroups. • Lack of independence in the tests: • If you know about group1 vs. group2 and if you also know about group1 vs. group3, you can make inferences (sort of) about group2 vs. group3.
Doing ANOVA • See Enterprise Guide Project for ANOVA.
After You do ANOVA • Do you have planned comparisons in mind? • Planning on looking at a reference group vs. all the others (e.g., placebo vs. 3 dosages) --- Dunnett’s test. • Planned comparisons on a couple of means: • The Bonferroni test is very conservative. That is, its power is too low. It is reasonable for 3 or 4 comparisons. • Compare all means: • If you get 3 statisticians in a room and ask them for the best test to do post hoc group mean comparisons, you will get at least 4 answers…. • Bonferroni - conservative • Tukey HSD – middle of the road • Student-Newman-Keuls - liberal
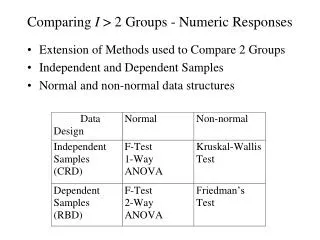
Non-Parametric ANOVA? • The Kruskal-Wallis test works if you do not have repeated measures. • The repeated measures non-parametric ANOVA analog is Friedman’s test. (It is like Wilcoxon rank-sum.)
Two-way ANOVA • You can extend the same modeling ideas to having two predictors. • You pick a baseline level in each predictor, then add something to change the baseline mean to represent the change in the mean associated with group membership for the other levels of the first predictor. You do the same process to represent the change from the baseline level in the other variable. • But… what happens if there are special impacts on the means from some combinations of the levels over the two predictors?