Download
1 / 99
990 likes | 995 Views
Introduction to the Theory of Constraints. Ing.J.Skorkovský , CSc. Department of Corporate Economy Faculty of Economics and Administration MASARYK UNIVERSITY BRNO Czech Republic. Introduction.

E N D
Introduction to the Theory of Constraints Ing.J.Skorkovský, CSc. Department of Corporate Economy Faculty of Economics and Administration MASARYK UNIVERSITY BRNO Czech Republic
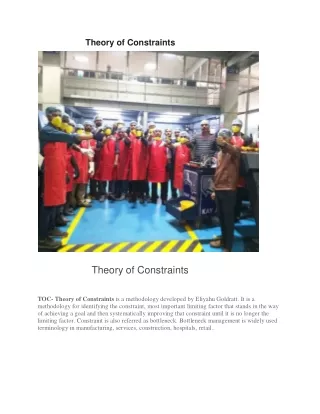
Introduction • Theory of Constraints - TOC) was formulated approximately in 1980 in the USA. Some important roots of this theory were connected to the ideas incorporated in programs for planning and production control (Optimized Production Technology)
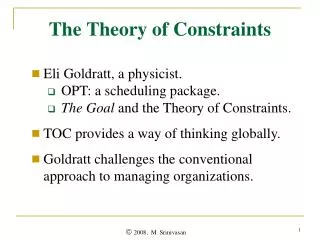
Introduction • Author: Eliyahu Moshe Goldratt
The Goalby Eliyahu Goldratt • The goal of a manufacturing company? Make money !!!
Introduction -novels TOC has became popular particularly thanks to thenovels : • The Goal - A Process of Ongoing Improvement • It´s Not Luck • The Race • The Critical Chain • The Haystack Syndrome • Necessary But Not Sufficient • Late night discussion • TOC was together with TQM (Total Quality Management ) and JIT (Just-In-Time) classified as one of the most important managerial methods of the last two decades of the twentieth century .
TOC Applicationareas • Company logistic • Project management (Critical chain) • Marketing • Sales • SCM=Supply Chain Management • Finance management and metrics
TOC wider use and application horizons • Support of decision making • Support of process improvements • Root problems detection
Causes-Problem-Effects Demotivated staff Unclear roles and expectations Vital information missing Poor communication between management and staff Haphazard supervisions and meetings Lot of staff changes Time pressures
Descisionmaking • Problemidentification (TOC) • Objectives(Max margin, stability, market share, lowercosts,… ) • Alternatives (differentsolutions) – Payoffs • ActivityBasedCosting • ContributionMargin (CM) and CM Ration • Comparingaltrenatives (Max,Max, MaxMin,… ) • Best alternativeischosen • Solutionisimplemented
TOC and Business Process Reengineering approach The TOC result OPTIMIST „Half of the glass is still empty ! TOC APPROACH „We have glass which is twice as big ! Not traditional approach Positive expectations PESSIMST „We have only half of the glass!“ The BPR result Traditional approach Negative expectations BPR (Business Process Reengeneering) approach „We have two times more than we really need __“
Some impacts of TOC implementation Ford Motor – Electronics Div. Revenue: $3,000,000,000 Number of employees: 15,000 Implementation Date: 1991 TOC Applications:DBR Comment:Drum-Buffer-Rope
Some impacts of TOC implementation IMPLEMENTATION RESULTS Inventory Decrease:Reduced 100 million dollars (50%) On-time performance:From 89% - to 98% Lead times:From 6.4 days with JIT to 2.6days Cost efficiency:Reduced floor space by 57% Quality:Reduced quality defects by 50%
LEAD Time explanation-purchase Quantity Ordered Quantity Lead time Date of Purchase order Placement Date of Delivery Time
Some impacts of TOC implementation Some companies using TOC applications: • BOEING –maintenancedepartments • MOTOROLA -research • GENERAL MOTORS • LOCKHEAD MARTIN (F 22) • BAE SYSTEMS • ………
A TOC B Which is harder to manage? Left or Right?
TOC • It is based on system approach • A company (enterprise) is to be understood as a chain of dependent processes – this picture below is very, very simplified See next slide Marketing Orders Purchase Production Packaging Shipment
Input Output Larger Process Process Process Process Input Output Input Output Input Output Process Theory – more complex than one way chain Process Input Output
Process Theory – more complex than one way chain RM FG FG RM RM RM RM RM RM RM RM RM Raw Material Finished Goods Linear or “I” system Aircraft assembly is more of an “A” Plant
TOC – system approach • Organizations / Systems exist for a purpose • That purpose is better achieved by cooperation of multiple, independent elements linked together • Pupose -BetterBottom Line • Each Inter-linked event depends in some detail upon the other links. • The system owner determines purpose
TOC (home study) • Most real systems could be seen in such a way, that there are only a few or better only one element (factor), which is the key point, where and only there all possible managerial methods have to be focused in order to control whole system • „Every system is based on inherent simplicity”. • This element in TOC is called Constraint of the system = bottleneck • Bottleneck:Any resource whose capacity is equal to or less than the demand placed upon it. Inherent :základní, podstatná. neodmyslitelná….
TOC- bottleneck I • Different link capabilities, normal variation and changing workload make it impossible to balance everything. • One element of the system is more limited than another.
TOC- bottleneck II • When the whole system is dependent upon the cooperation of all elements, the weakest link determines the strength of the chain. • An exactly balanced chain (system) is stronger than a non-homogeneous chain, but when close to the breaking point, all links must be managed Bottleneckishere !!!!
TOC • Why constraint ? • Constraint prevents to reach the goal (make money now and in the future) • The TOC goal : „Make money now and in the future“ • Every system has at least one such a constraint. The system without such a bottlenecks would reach the predefined business plans in infinite volumes.
TOC : of the costs • Traditional approach – world of where the aim of any endeavour is to optimize locally every segment of the chain, meaning balancing the capacity of every element and not the flow through the chain Maximization of the efforts Shipment Marketing Packaging Orders Purchase Production
TOC : of the throughput • Use of : „common sense“ • The consistent focus of the bottleneck- – global optimization Maximization of the efforts Marketing Orders Purchase Production Packaging Shipment
World of costs: main metric – the weight of the chain (every decrease of the weight of any components will result in better efficiency (performance) Total improvement = sum of local improvements World of throughput: main metric –the compactness of the chain Only improvement of bottleneck will improve performance of the whole chain Total improvement = improvement of the bottleneck TOC
Cost Model vs. Constraint Model The cost accounting model—the norm in most organisations—is a financial model that was never designed to run the business. The cost model focuses on price per unit, while the constraint model focuses on price per unit of time spent at the constraint, a measure known as ‘product octane’. Both the cost and constraint accounting models are necessary, but many organisations use the cost model for both purposes. As the constraint in any business operation limits the flow of throughput, maximising the octane is the goal of constraint accounting. The throughput model yields a dramatically different view of the relative profitability of different products. This provides a new perspective regarding the appropriate product mix and target markets. Adopting a ‘constraints’ approach to profit maximisation can easily lead to a 25% increase in operating profits, with significant additional cash flow benefits. Moreover, you’ll reduce inventories and work-in-progress, and make smarter—and less costly—sales and marketing decisions. Resource: https://ensembleconsultinggroup.com/method/operations-toc-overview/management-accounting/
Life show (second hypertext link) • http://www.tocca.com.au/ • www.tocca.com.au/Services/demomanufacturing.htm
TOC Five steps process: Step 0. Identify the Goal of the System/OrganizationStep 0.5 Establish a way to measure progress to Goal • Step 1. Identifythe system’s constraint. • Step 2. Exploitthe system’s constraint. • Step 3. Subordinateeverything else to the above decision. • Step 4. Elevatethe system’s constraint. • Step 5. If a constraint is broken (that is, relieved or improved), go back to Step 1. But don’t allowinertiato become a constraint. http://www.leadingagile.com/2014/01/theory-constraints-brooks-law/ Adding manpower to a late software project makes it later ! Brooks´law !!!
TOC • „Cost Accounting is enemy number one of productivity“. * • Impact on the behaviour of the people and they habits of finding and improvements of local elements having reason in optimising of these particles. • New metrics were introduced – already presented * Eric Noreen, Debra Smith and James t. Mackey
Definition (TOC metric) - summary • Throughput (T):The rate at which the system generates moneythrough sales. • Note that the money is generated through sales and not production because if you produce something and don’t sell it, you have not really had throughput. (You’ve just put it into inventory). • Inventory (I):All the money that the system has invested in purchasing things, which it intends to sell. • Operational Expense (OE):All the money the system spends in order to turn Inventory into Throughput. See classification of OE later in this show
TOC metrics more in detail (T) • throughput is the rate at which a system achieves its goal. Often this is monetary revenue and is in contrast to output, which is inventory that may be sold or stored in a warehouse. In this case throughput is measured by revenue received (or not) at the point of sale—exactly the right
TOC metrics more in detail (OE) • Operating expenses includes e.g. : • accounting expenses • license fees • maintenance and repairs, such as snow removal, trash removal, janitorial service, pest control, and lawn care • advertising • office expenses • supplies • attorney fees and legal fees • utilities, such as telephone
Repetition of a topic that has already been reported on TOC • TOC as a managerial paradigm • Literature /resources • TOC and Business Process Reengineering (pessimistic and optimistic approach) • Chain of processes • Bottleneck and its definition and impacts • DBR –first approach • Cost world and Throughput worlds • -the weight of the chain (every decrease of the weight of any components will result in better efficiency (performance) • - the compactness of the chain (only improvement of bottleneck will improve performance of the whole chain) • Basic metrics (T,OE, Inventory) • Five focusing steps (Find, Exploit, Subordinate, Elevate , go beck to 1)
Measuring the goal(TOC metric) • Net profit (NP=T-OE) :( T, I and OE was alreadyexplained in this course) -> T=Net Sales – TVC =S-TVC, where TVC=TotalVariableCosts • Cash • Return on Investment (ROI=NP/I) • Throughput =T • Inventory = Investment =I • Operating Expenses =OE
TOC –required trends Inventory Operational Expense Throughput
T,I,OE,NP and ROI example(home study) • NP=T-OE = (S-TVC) – OE ; whereTVC=TotalVariableCostsand S=Unit Price • ROI=(T-OE)/I=NP/I, where NP=Net Profit • where T=total throughput(pcs/unit oftime) A C D E B 10 13 7 9 11 • Only one product !!! In ourexample TVC=0 • Unit Price (Selling price) = 100 USD = S • Raw material /one product =35 USD =OE • NP/product=(T-OE)=100-35=65 • 176 hours/month (constraint of the company) • T=176 * 7 = 1232 parts/month • MonthlyNP =1232 * 65 USD = 80 080 USD CCR=Capacity Constraint Resource= =weakest link of the chain= bottleneck
T,I,OE,NP and ROI example(home study) • 1st suggestion is to optimize B from 13->14 parts per hour • T will not increase ->You cannot produce more than 7 !!!! • Investment to optimize B=5000 USD with depreciation 10 % • OE(month) =(5000 USD * 0,1)/12= 41,67 -> 42 USD(whenrounded) A B C D E 10 13->14 7 9 11 • Only one product • Unit Price (Selling price) = 100 USD • Raw material /one product =35 USD =OE • NP/product=100-(35+42)=23 • 176 hours/month (constraint of the company) • T=176 * 7 = 1232 parts/month • MonthlyNP =1232 * 23 USD = 28 336 USD CCR=Capacity Constraint Resource=weakest link
T,I,OE,NP and ROI example(home study) • T = throughputwill not increase • NP(Net Profit) will decrease based on increased OE (41,67 USD /month) • Based on NP decrease ROI is negative • Bad suggestion !!!!!! A B C D E 10 13 7 9 11 CCR=Capacity Constraint Resource= =weakest link
T,I,OE,NP and ROI example(home study) • 2nd suggestion is to optimize C from 7->7,1 parts/hour • part of the 2nd suggestion is an extra load of E so it goes from 11->10 • Necessary investment is 5000 USD(remains the same) • Increase of the T=production/month = 0,1*176=17,6 parts • Increase of the company NP= 17,6*23 USD= 404USD/month A B C D E 10 13 7->7,1 9 11->10
T,I,OE,NP and ROI example(home study) • Necessary investment is 5000 USD = I =Inventory= Investment • Increase of the T= production/month = 0,1*176=17,6 parts • Increase of the company/month NP= 17,6*23 USD= 404USD • OE/month =(5000 * 0,1)/12= 41,67 -> 42USD • OE will be increased by 42 USD/month • Annual increase of the NP = 404*12=4848 USD • ROI=NP/I = (28336*12+4848)/5000 = 69 % !!! • T does not measure local efficiencies, except at the constraint- seenextslide A B C D E 10 13 7->7,1 9 11->10
Throughput • T=176 * 7,1= 1250parts/month (rounded) • MonthlyNP =1250* 23 USD = 28 750 USD • Originally : • T=176 * 7 = 1232parts/month (rounded) • MonthlyNP =1232 * 23 USD = 28 336 USD