Download

1 / 9
110 likes | 298 Views
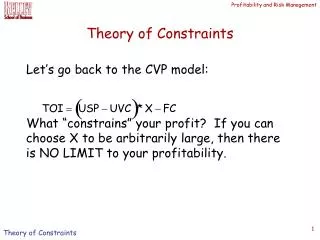
Introduction to the Theory of Constraints. J.Skorkovský, PhD.; KPH ESF MU. Measuring the goal (TOC metric). Net profit (NP=T-OE) : ( T , I and OE will be explained later in this course) -> T=Net Sales – TVC =S-TVC Cash Return on Investment (ROI =NP/I)

E N D
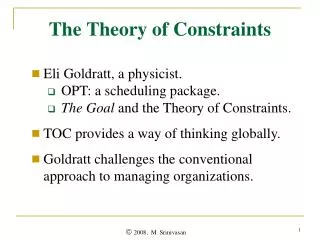
Introduction to the Theory of Constraints J.Skorkovský, PhD.; KPH ESF MU
Measuring the goal(TOC metric) • Net profit (NP=T-OE) :( T, I and OE will be explained later in this course) -> T=Net Sales – TVC =S-TVC • Cash • Return on Investment (ROI=NP/I) For a manufacturing enterprise, the goal can also be measured by: • Throughput =T • Inventory = Investment =I • Operating Expenses =OE
TOC –required trends Inventory Operational Expense Throughput
T,I,OE,NP and ROI example • NP=T-OE = (S-TVC) - OE • ROI=(T-OE)/I=NP/I • where T=total throughput A C D E B 10 13 7 9 11 • Only one product • Unit Price (Selling price) = 100 USD • Raw material /one product =35 USD =OE • T/product=100-35=65 (S-TVC) • 176 hours/month (contraintofthecompany) • T=176 * 7 = 1232parts/month • Monthly T =1232 * 65 USD = 8 080 USD CCR=Capacity Constraint Resource= =weakest link of the chain= bottleneck
T,I,OE,NP and ROI example • 1st suggestion is to optimize B from 13->14 parts per hour • T will not increase ->You cannot produce more than 7 !!!! • Investment to optimize B=5000 USD with depreciation 10 % • OE(month) =(5000 USD * 0,1)/12= 41,67 -> 42 USD A B C D E 10 13 7 9 11 CCR=Capacity Constraint Resource= =weakest link
T,I,OE,NP and ROI example • T = throughputwill not increase • NP(Net Profit) will decrease based on increased OE (41,67 USD /month) • Based on NP decrease ROI is negative • Bad suggestion !!!!!! A B C D E 10 13 7 9 11 CCR=Capacity Constraint Resource= =weakest link
T,I,OE,NP and ROI example • 2nd suggestion is to optimize C from 7->7,1 parts/hour • part of the 2nd suggestion is an extra load of E so it goes from 11->10 • Necessary investment is 5000 USD(remains the same) • Increase of the production/month = 0,1*176=17,6 parts • Increase of the company T= 17,6*65 USD= 1 144 USD A B C D E 10 13 7->7,1 9 11->10
T,I,OE,NP and ROI example • Necessary investment is 5000 USD = I =Inventory= Investment • Increase of the production/month = 0,1*176=17,6 parts • Increase of the company T= 17,6*65 USD= 1 144 USD • OE/month =(5000 * 0,1)/12= 41,67 -> 42USD • OE will be increased by 41,67 USD/month • Annual increase of the NP = (T-OE)*12=(1144-42)*12 =13 244 USD • ROI=NP/I = 13244/5000 = 265 % !!! • T does not measure local efficiencies, except at the constraint A B C D E 10 13 7->7,1 9 11->10