Download
1 / 17
170 likes | 283 Views
Useful Tips for Presenting Data and Measurement Uncertainty Analysis. Ben Smarslok. Outline. Why is presenting data properly important? Explain important terminology and definitions NIST vs. ISO vs. ASME/ASTM Oberkampf definitions of model uncertainty (not included)

E N D
Useful Tips for Presenting Data and Measurement Uncertainty Analysis Ben Smarslok University of Florida Mechanical and Aerospace Engineering
Outline • Why is presenting data properly important? • Explain important terminology and definitions • NIST vs. ISO vs. ASME/ASTM • Oberkampf definitions of model uncertainty (not included) • Experimental scenarios and corresponding methods • Uncertainty propagation • Crossed vs. nested factors (ANOVA vs. VCA) • p-values • Interlaboratory Studies (not included) University of Florida Mechanical and Aerospace Engineering
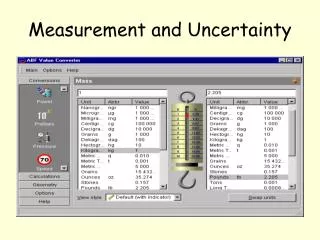
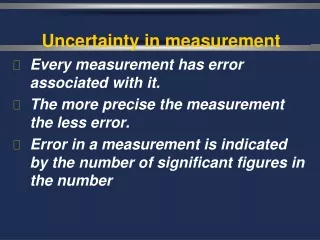
m = 75 ± 5 g What is the meaning of ± 5 ? • Best guess by experimenter • Half the smallest division of measurement • Standard deviation: • Standard error: m = /n • Expanded uncertainty of ± 2 or ± 3 (95% or 99% confidence interval) • Standard uncertainty: u • Combined standard uncertainty: uc *(Courtesy of Duane Deardorff presentation from UNC) University of Florida Mechanical and Aerospace Engineering
What does x ± u mean? • Engineers think in terms of ±2 (95%) • Physicists generally report ±1 (68% CI) • Chemists report ±2 or ±3 (95% or 99% CI) • Survey/poll margin of error is 95% CI • Accuracy tolerances are often 95% or 99% • NIST Calibration certificate is usually 99% • Conclusion: The interpretation of ± u is not consistent within a field, let alone between fields • It is very important to explain the statistical relevance of the uncertainty bounds!!! University of Florida Mechanical and Aerospace Engineering
Presenting Uncertainty Precisely • Choose a standard for presenting uncertainty (I prefer NIST), and reference the standard • Explain the source of the uncertainty • Type A – calculated by statistical methods (it is useful to explain the design of experiments and the number of samples involved) • Type B – determined by other means, such as estimate from experience or manufacturers specifications • Use terms carefully! • Error vs. Uncertainty: Error is the deviation from the true value and measured value (never known), which is estimated as uncertainty • Bias vs. variability (will explain later) • Avoid use of ambiguous ± notation without explanation • Pet peeve: • COV = covariance University of Florida Mechanical and Aerospace Engineering
Type of evaluation: Type A – calculated by statistical methods Type B – determined by other means, such as estimate from experience NIST Classification of Measurement Uncertainties • Uncertainty classification: • Random uncertainty / variability – scatter in the measurements (v) • Systematic uncertainty / bias – systematic departure from the true value (b) xt= true value of specimen m= experimental population average x= experimental sample average vx= random error of sample bx= systematic error of sample Range is at 95% (2s) level of a normal distribution University of Florida Mechanical and Aerospace Engineering
P = Load • A = Area • e2 = transverse strain 2 1 Total Uncertainty Bias & Variability Components Contributors Uncertainty Analysis Example • Consider our transverse modulus work (E2) • Hooke’s Law: • We will work through this problem backwards University of Florida Mechanical and Aerospace Engineering
Level 1: Total Uncertainty • In general, • where, vX and bX were propagated from component uncertainties = Student’s t distribution at 95% confidence level (depends on # of DOF) • Total uncertainty of E2 at 1s (68%) confidence for comparison to experimental results • Or, at the commonly accepted 95% level University of Florida Mechanical and Aerospace Engineering
Level 2: Uncertainty Propagation • Law of Propagation of Uncertainties (LPU): • where, p are the inputs (components) and q is the output • E2 Example: • Uncertainty contributors were analyzed for each of the components of E2 • Random and systematic effects propagated separately • Only systematic uncertainties can have correlated effects • Thickness and width are correlated University of Florida Mechanical and Aerospace Engineering
Level 3: NIST Component Measurement Uncertainty Table University of Florida Mechanical and Aerospace Engineering
Nested Crossed Patients unique to each hospital. Same patients in each hospital. Level 4: Contributors of Component Uncertainty(Further Analysis) • Numerous different methods to analysis the significance of uncertainty contributors • It is important to use the appropriate analysis method depending on the design of experiments (DOE) • Either design the experiments properly or match the corresponding method to the data you already have • Most DOEs fall into one of these two categories: University of Florida Mechanical and Aerospace Engineering
Crossed Design: ANOVA • Crossed (or factorial) DOEs correspond to analysis of variance (ANOVA) • Consider thickness in the E2 example • Since the SAME specimens were measured in the SAME positions with the SAME users, then the factors were crossed • 3-way ANOVA with crossed, random variables was conducted Uncertainty contributors: Specimen – variability from specimen to specimen Position – variation across measurement surface User – error from user technique Measurement repeatability Nominal: 0.09 x 1 in. University of Florida Mechanical and Aerospace Engineering
Hypothesis Test for A: Thickness ANOVA • 3-way ANOVA of crossed, random variables • Statistical software available for ease of use: Excel for 2 factors or SAS for 3 or more • Factors: • A = specimen a = 4 • B = position b = 3 • C = user c = 4 • Repetitions: n = 3 • ANOVA model: • ANOVA results were not directly used in uncertainty analysis, but were used to identify significant contributors and validate uncertainty estimates University of Florida Mechanical and Aerospace Engineering
Results: Thickness ANOVA • Use ANOVA to deterimine the significance of the contributors of uncertainty in thickness • Position is most significant factor with p-value = 0.006 • Not as interested in interactions in this study • Used to validate estimated range of uncertainties of thickness and width ~ ~ ~ University of Florida Mechanical and Aerospace Engineering
Nested Design: VCA • Nested DOEs correspond to variance component analysis (VCA) • Consider a two-stage nested design of one specimen for thickness • Relevant if positions and users were unique each time • Specimens considered individually since the thickness does not have to be the same from one specimen to the next • Data was organized according to position • y1, y2, and y3 refer to the repeated basic measurements University of Florida Mechanical and Aerospace Engineering
where, i is a component in the process Variance Component Analysis of Thickness • Goal: Develop a nested design to determine the contribution of each factor in the overall variance • Variance of the measurement process for one specimen • Position – the three locations on the specimen where the thickness was measured (unique to each specimen) • User – four different users per position performed the measurements • Basic Measurement – three repeated measurements by each user at each position • Compare the weight of each contributor to determine significance University of Florida Mechanical and Aerospace Engineering
Concluding Remarks • Using proper statistical terminology and representation is necessary to have meaningful results • You can say your results are “pretty good”, but give what your definition of “pretty good” is! • Depending on the project, more or less uncertainty analysis may be required • It is important to design your experiments with the statistical analysis in mind • Age-old question: How many measurements do I need? • Obviously depends on the circumstances, so there is no straight forward answer • Best recommendation: Feel comfortable enough with your results that you can predict the next measurement within a desired range University of Florida Mechanical and Aerospace Engineering