Download
1 / 14
140 likes | 150 Views
Optimizing your Catastrophe Reinsurance Program: Making Recommendations to the Board. Casualty Actuarial Society Loss Reserving Seminar Washington, D.C. September 18-19, 2008. Glenn Hiltpold, F.C.A.S. Probability. on Non-. Return. Gross. Exceedance. Time. PML. 90.00%. 10.

E N D
Optimizing your Catastrophe Reinsurance Program:Making Recommendations to the Board Casualty Actuarial Society Loss Reserving Seminar Washington, D.C. September 18-19, 2008 Glenn Hiltpold, F.C.A.S.
Probability on Non- Return Gross Exceedance Time PML 90.00% 10 $1,124.4 95.00% 20 $11,586.4 96.00% 25 $20,157.6 98.00% 50 $60,110.5 99.00% 100 $99,618.5 99.50% 200 $169,671.2 99.75% 400 $267,216.2 The PML Curve
The 100 Year Storm “So, is this going to happen once every 100 years?”
The PML Curve Solution 1 – Use Logic to more accurately describe the curve… “Probable Maximum Loss = Improbable Minimum Loss”
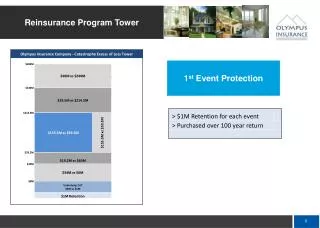
The PML Curve Solution 2 – Visual Depiction of how Cat Reinsurance transforms the curve Three Choices: 1. Upper Limit 2. Company Retention (“Lower Limit”) 3. Company Participation
The PML Curve We still have the same problem. The graphs are interesting, and are a good aid in understanding what reinsurance will do to your catastrophe risk, but how do you go from the picture to a proposed reinsurance structure? (Especially considering the fourth graph.)
The PML Curve Solution 3 – - Do Not focus on specific PML points. - Instead, split the curve into company specific “Regions” 1. No Hurricane 2. “Annoyance” 3. “Irritation” 4. “Impairment” 5. “Devastation”
Regions Further Defined 1. No Hurricane – From the PML Curve, what is the probability that there is NO event in a given year? 2. “Annoyance” – Probability of events with Loss from >$0 to <5% of Surplus. • “Irritation” – Probability of events from >5% of Surplus up to Expected Net Income. • “Impairment” – Probability of events >Net Income, but less than Surplus. 5. “Devastation” – Probability of events > Surplus.