Download
1 / 43
430 likes | 534 Views
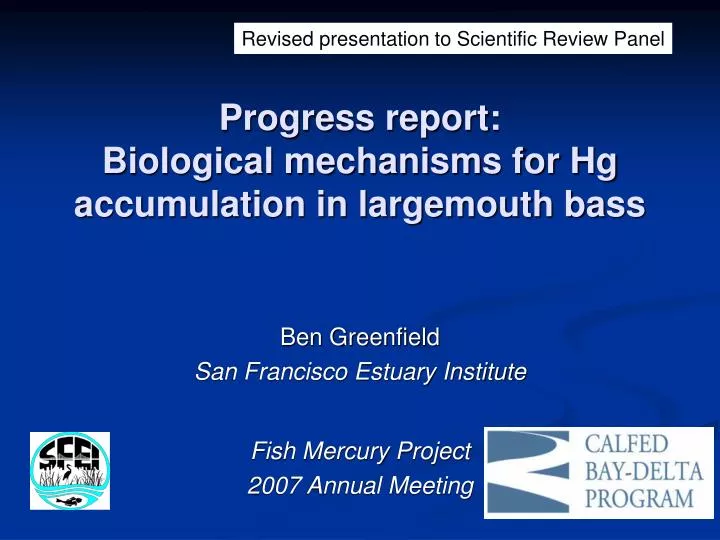
Revised presentation to Scientific Review Panel. Progress report: Biological mechanisms for Hg accumulation in largemouth bass. Ben Greenfield San Francisco Estuary Institute. Fish Mercury Project 2007 Annual Meeting. Largemouth Bass Hg Modeling. Committee reviewed Workplan Jan. 2007

E N D
Revised presentation to Scientific Review Panel Progress report: Biological mechanisms for Hg accumulation in largemouth bass Ben Greenfield San Francisco Estuary Institute Fish Mercury Project 2007 Annual Meeting
Largemouth Bass Hg Modeling • Committee reviewed Workplan Jan. 2007 • Workplan focus: • Can biological mechanisms explain spatial differences in fish Hg? • Can biological mechanisms explain variation among individuals? • What are the seasonal and annual dynamics of Hg accumulation? • What proportion of Hg burden explained by recent growth?
Largemouth Bass Hg Modeling • Committee reviewed Workplan Jan. 2007 • Workplan focus: • Can biological mechanisms explain spatial differences in fish Hg? • Can biological mechanisms explain variation among individuals? • What are the seasonal and annual dynamics of Hg accumulation? • What proportion of Hg burden explained by recent growth?
Talk outline • Conceptual model • Selected results • Biological drivers of spatial variation in Hg (Questions 1 and 2) • Growth rate • Consumption rate
Conceptual model of Hg uptake into fish Fish Mercury Growth Prey Mercury (MeHg) Consumption Elimination Egestion Spawning Loss • Multiple Drivers • Bioavailable Hg • Methylation processes • Uptake into lower • trophic levels
Fish Mercury Growth Prey Mercury (MeHg) Consumption Elimination Egestion Spawning Loss • Multiple Drivers • Bioavailable Hg • Methylation processes • Uptake into lower • trophic levels
General Approach • Query the FMP and other datasets • Focus on consumption and growth • Statistical and mechanistic modeling • Linear and nonlinear modeling • Bioenergetics model • Hg mass balance model
Results: growth rate • Hypothesis: Higher Hg in slower growing fish explains huge variation in largemouth bass Hg • Essington and Houser 2003; Simoneau et al. 2005 • “Growth dilution” • Evaluate using estimates of growth rate based on scale data (Gary Ichikawa, CDFG) • Statistical and mechanistic modeling
Calculate nonlinear growth curve using • Age vs. length data (Von Bertalanffy) • Use residuals of this growth curve to • estimate relative growth rate of individual fish
Regional patterns in growth residuals not associated with Hg • Hg vs. growth residuals by watershed; Pearson’s r = 0.02; N = 6 *
Examine growth residual (G) vs. Hg accounting for regional differences • General linear models to look at effect within stations • Square root Hg = f (station, G, length) • G positively associated with Hg • Positive effect of body size at a given age • Mechanism may be higher Hg in larger prey • G not significant after length accounted for • Growth dilution hypothesis not supported
Modeling effect of growth rate • Mechanistic bioenergetic and Hg mass balance model provided by Marc Trudel • Ran simulation for growth and Hg uptake from age 2 to 7 largemouth bass • Calibrated model to Hg data from Frank’s Tract and to von Bertalanffy growth curve • Evaluated effect of refitting model to 95% upper and lower confidence interval growth rates for data set • Effect on change in Hg over simulation period • Growth changed by separately changing consumption rate or activity coefficient
Changing growth rate has limited effect on changes to Hg concentration • Modifying growth by changing consumption -less than 5% effect • Modifying growth by changing activity - about 20% effect • Direction of effects are consistent with growth dilution Increased growth Decreased growth
Effect of growth rate much lower than effect of prey Hg • Prey Hg changed from silverside at Big Break to silverside at Cosumnes River • Hypothesis not supported Higher growth Lower growth Decreased growth
Fish Mercury (C) Growth (G) Prey Mercury (Cd) Consumption (I) Elimination (E) Egestion (1- a) Spawning Loss (K) Results: consumption rate • Hypothesis: fish with higher consumption rates will have higher tissue Hg • Consumption rates back-calculated using Hg mass balance model (Trudel et al. 2000) • Parameter estimates were obtained using local data on size, growth, bass Hg, silverside Hg, and temperature
Increased consumption estimate not associated with increased tissue Hg
Modeled consumption rate tracks bioaccumulation factor • Consumption rate estimate proportional to Hgfish/Hgprey • Model indicates potential mechanism but not an independent assessment • Don’t have access to best prey Hg data yet
Summary • Growth rate differences not responsible for Hg variation • Hg positively associated with size at a given age • Mechanistic model did not explain much variation • Preliminary consumption rate results don’t indicate positive association with Hg • Preliminary findings consistent with interpretation that abiotic and lower-food web processes drive bass Hg • Hg spatial patterns not driven by fish biology
Next steps • More extensive mechanistic modeling • Systematically vary growth, consumption, temperature, and prey Hg according to observed ranges • Shift focus to temporal dynamics of Hg uptake from prey (Questions 3 and 4) • Dependant on collaboration with UC Davis team to examine implications of fluctuations in small fish Hg
Acknowledgements Aroon Melwani, John Oram, Jennifer Hunt SFEI Marc Trudel, Department of Fisheries and Oceans, Canada Gary Ichikawa, CDFG Darell Slotton and Shaun Ayres, UC Davis
Potential biological drivers of Hg variation • Growth rates (growth dilution, starvation concentration) • Consumption rates • Metabolic activity • Fish health • Alternatively, prey Hg (e.g., trophic position)
Bass Hg does not closely track silverside Hg (Grenier et al. 2005 Year 1 Sportfish Report) • Possibility for mechanisms related to bass growth and consumption
Overall model R2 = 0.95 SJR Vernalis SJR Potato Slough • General approach: Develop relative body condition using length weight residuals • Significant differences among sites (ANCOVA using GLM)
Results: body condition • Hypothesis: body condition negatively associated with [Hg] • Greenfield et al. 2001; Swanson et al. 2007 • Condition = Residuals of length vs. weight regression • Thinner, leaner fish may be consuming and respiring more to maintain current body mass. • “Starvation concentration”
No regional patterns in relative body conditions • Hg vs. condition by watershed; Pearson’s r = 0.08; N = 9 • Similar results for individual fishes (ancillary materials) • Hypothesis not supported
Examine spatial patterns in relative body conditions - no broad association with Hg Condition Hg Sacramento Sacramento Delta Delta San Joaquin San Joaquin
Body condition vs. Hg among individual fish within a site • Approach: • Generate body condition estimates for each individual largemouth bass (N = 498) • Generate estimates of Hg variation within sites • Residuals from ANOVA of Hg vs. site • No relationship between condition and Hg (linear regression p > 0.5) • Body condition not associated with Hg
Graphical analysis of growth rate differences in 3 regions Cosumnes/Mokelumne Feather River Delta
Statistical output of growth residual analysis • G positively associated with Hg • Results indicate a positive effect of body size at a given age • Length vs. Hg stronger than G vs. Hg • Growth residual not significant after length accounted for • Mechanism may be higher Hg in larger prey • Hypothesis not supported
Example plots of growth residuals vs. Hg at individual stations Sacramento River At River Mile 44 Camanche Reservoir • At some stations (e.g., Sacramento River at River Mile 44), growth residual was positively related to Hg • This is not consistent with the growth dilution hypothesis • At many stations (e.g., Camanche Reservoir), there was not apparent relationship between growth residual and Hg
Fish Mercury (C) Growth (G) Prey Mercury (Cd) Consumption (I) Elimination (E) Egestion (1- a) Spawning Loss (K) Hg mass balance model • Trudel, M., Tremblay, A., Schetagne, R., Rasmussen, J.B., 2000. Estimating food consumption rates of fish using a mercury mass balance model. Canadian Journal of Fisheries and Aquatic Sciences 57, 414-428.
What proportion of Hg burden can be explained by recent growth? • Hypothesis: majority of Hg burden due to recent growth • Preliminary estimates based on empirical data • Burden = body mass * Hg concentration • Estimated representative body mass at a given age using length at age model and length-mass regression • Calculated Hg concentration at given age
SJ River At Vernalis Cosumnes River Franks Tract • 60 to 80% Hg due to past 2 yr of growthHypothesis supported