Download
1 / 10
110 likes | 261 Views
Public FTAA.ecom/inf/147 June 5, 2002 Original: English. Latin America Trade, Tariffs and Competitiveness. I. Growth Competitiveness. II. Economic Creativity. III. Trade and Tariffs. IV. Impact of Trade Barriers. V. ITA - one way to eliminate tariffs. VI. Benefits of lowering tariffs.

E N D
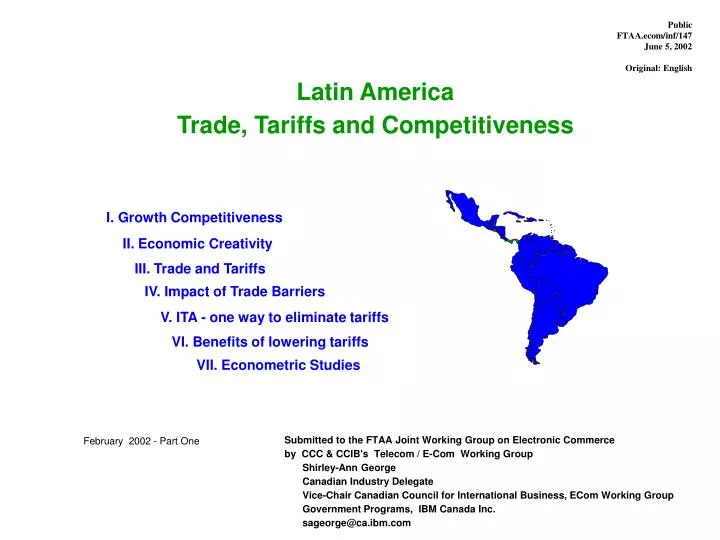
Public FTAA.ecom/inf/147 June 5, 2002 Original: English Latin America Trade, Tariffs and Competitiveness I. Growth Competitiveness II. Economic Creativity III. Trade and Tariffs IV. Impact of Trade Barriers V. ITA - one way to eliminate tariffs VI. Benefits of lowering tariffs VII. Econometric Studies • Submitted to the FTAA Joint Working Group on Electronic Commerce • by CCC & CCIB's Telecom / E-Com Working Group • Shirley-Ann George • Canadian Industry Delegate • Vice-Chair Canadian Council for International Business, ECom Working Group • Government Programs, IBM Canada Inc. • sageorge@ca.ibm.com February 2002 - Part One
Latin America: Trade, Tariffs and Competitiveness • Explores link between trade, tariffs and competitiveness • focus on Information Technology and Latin America • Combines data from various international sources • World Economic Form and Harvard University • World Trade Organization (WTO) • IMF World Economic Outlook (WEO) Database • Econometric Studies - Country specific • Brazil • Federacao das Industries do Rio de Janeiro (Firjan) • LCM Consultores Associados • Argentina • Fundacion de Investigaciones Economicas Latinoamericas (FIEL)
I. Growth Competitiveness Ranking for 59 Countries • World Economic Forum and Harvard University Report for 2000 • Measures factors contributing to rapid growth in GDP per capita • Macroeconomics and microeconomics determinants • Index composed of: • Economic Creativity Index • measures emergence of new businesses • technology innovation or technology transfer - does it matter? • Finance Index • efficient financial system, high rates of savings and investment • International Index • economic integration with the global economy • Build on the Competitiveness Index of prior years Source: Global Competitiveness Report 2000
Growth Competitiveness Rankings for 2000 Advanced Economies in blue Latin American Economies in red * Other Developing Economies in green * 1 21 41 US Japan China 2 22 42 Singapore France Egypt 3 23 43 Luxembourg Portugal Mexico 4 24 44 Netherlands Iceland Indonesia 5 25 45 Ireland Malaysia Argentina 6 26 46 Finland Hungary Brazil 7 27 47 Canada Spain Jordan 8 28 48 HK Chile Peru 9 29 49 UK Korea India 10 30 50 Switzerland Italy El Salvador 31 51 Thailand Bolivia 11 Taiwan 32 52 Czech Rep. Colombia 12 Australia 33 53 S. Africa Vietnam 13 Sweden 34 54 Greece Venezuela 14 Denmark 35 55 Poland Russian Fed. 15 Germany 36 56 Mauritius Zimbabwe 16 Norway 37 57 Philippines Ukraine 17 Belgium 38 58 Costa Rica Bulgaria 18 Austria 39 59 Slovak Rep. Ecuador 19 Israel 40 Turkey 20 NZ * IMF World Economic Outlook definition of advanced and developing countries Source: Rankings from Global Competitiveness Report 2000
Growth Competitiveness Rank vs. Average Tariffs for all Goods countries are clustered in groups of 5 Average for all 59 is 7.9% countries source: Global Competitiveness Report 2000
Growth Competitiveness Rank vs. IT Tariffs countries are clustered in groups of 5 source: Global Competitiveness Report 2000; www.ita.doc.gov
II. Economic Creativity Index measuring emergence of new businesses Technology Innovation Technology Index Technology Transfer Economic Creativity Index Ease of Activating New Businesses Venture Capital Availability Start Up Index Obtain Loan with little Collateral Source: World Economic Forum Competitiveness Report for 2000
Economic Creativity Index 2000 for selective countries Source: World Economic Forum Competitiveness Report for 2000
Economic Creativity Index vs. IT Tariffs for Selected Countries Source: World Economic Forum Competitiveness Report for 2000
Technology Innovation or Transfer - does it matter? Primary Source of Technology for 20 Largest Economies National Innovation Technology Transfer Rank Country IT tariff 1 US (Nafta) 0% X 2 JAPAN 0% X 3 GERMANY 0% X 4 UK 0% X 5 FRANCE 0% X 6 ITALY 0% X 7 CHINA 18% X 8 CANADA (Nafta) 0% X 9 BRAZIL 34% X 10 SPAIN 0% X 11 MEXICO (Nafta) 0% X 12 INDIA 40% X 13 KOREA 8% X 14 AUSTRALIA 0% X 15 NETHERLANDS 0% X 16 TAIWAN 10% X 17 ARGENTINA 10% X 18 SWITZERLAND 0% X 19 BELGIUM 0% X 20 SWEDEN 0% X Source: World Economic Forum Competitiveness Report for 2000 and International Trade Administration, US Depart. of Commerce