Download
1 / 33
330 likes | 470 Views
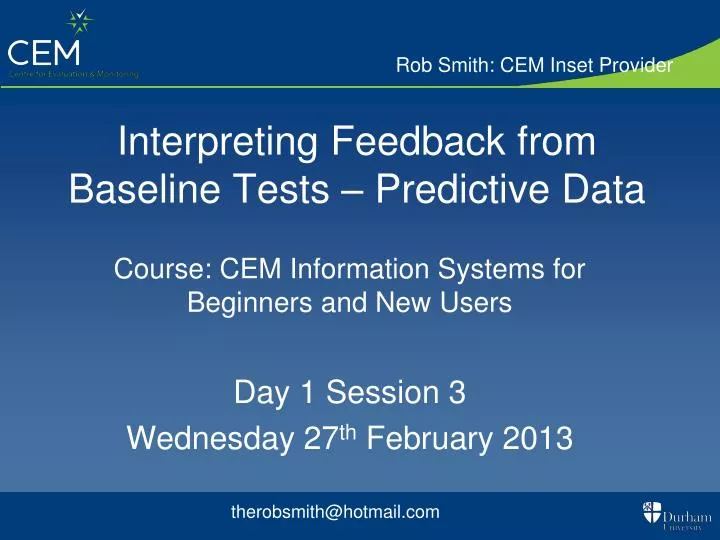
Rob Smith: CEM Inset Provider. Interpreting Feedback from Baseline Tests – Predictive Data. Course: CEM Information Systems for Beginners and New Users Day 1 Session 3 Wednesday 27 th February 2013. therobsmith@hotmail.com. What are “Predictions”, and how are they generated?.

E N D
Rob Smith: CEM Inset Provider Interpreting Feedback from Baseline Tests – Predictive Data Course: CEM Information Systems for Beginners and New Users Day 1 Session 3 Wednesday 27th February 2013 therobsmith@hotmail.com
What are “Predictions”, and how are they generated? The grades generated by the CEM systems are not predictions, but average performance by similar students in the most recent examination
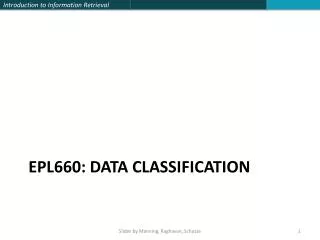
50% on or above the trend line A* Subject National trend line (regression line) * ** *** ******************* A * ** *** ******************************** B * ** *** ********************************* *** ** * ‘PREDICTION’ (expected grade) C * ** *** ************************************ *** ** * POINTS GRADE * ** *** ******************************** **** ** * * ** ***************************** *** ** * * ** *** ******************* ** * * 50% on or below the trend line * ** *********** ** * X BASELINE SCORE
3 key points are: • The higher the baseline score the higher the final grade • Any one grade is achievable from a range of baseline scores • From any baseline score, a range of grades is possible
Trend line 6.6 points = A/B 4 points = D 98 128
The word ‘PREDICTION’: Quite probably the most contentious term that is used!! Concerns include: • A prediction for GCSE at start of year 7? • What has the baseline test got to do with my subject? • I know my pupils! • The predictions are too low/too high: not valid!!! • And what about my professional judgement?
The word ‘PREDICTION’: • Alternatives include: • Expected grade • Minimum attainment/achievable grade • Baseline suggested grade • It assumes averageprogress and you would hope that your students make above average progress • But you know that all of them don’t!!!!
FACTORS THAT WILL INFLUENCE RELIABILITY OF ‘PREDICTIONS’: • Knowledge of student • Parental support/home life • Peer influences/social life • Student attitude, interest, language • Expectations of staff • Department/institution ethos • Resources • Quality of teaching and learning: pace of lessons • Understanding how children learn……… • And the reliability of the predictions......
Correlation = 1 Result
Correlation = 0 Correlation = 0.7
Point and grade ‘predictions’ to GCSE • Compare the predictions for English and Mathematics. • What pattern do you notice? • Look at Art and Design, Biology and French. Comments?
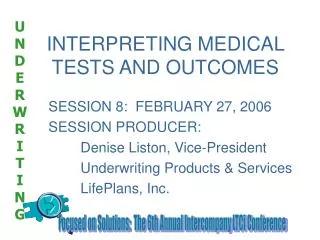
The graph below shows the middle 2/3 of some subject trend lines
Physics Maths Psychology Sociology Latin Photography English Lit Some Subjects are More Equal than Others…. A B >1 grade Grade C D E C B A A* Average GCSE
Or insert own values and click adjust
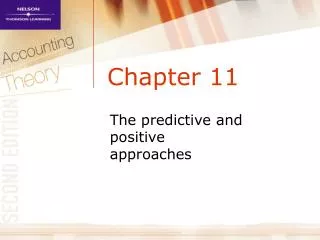
‘Predictions’ should be used in conjunction with Chances Graphs Prediction/expected grade: 5.1 grade C Most likely grade Blue bars represent the probability of the student achieving each grade
Prediction/expected grade: 6.4 grade A/B Most likely grade
Chances Graphs can serve as • awarning for top scoring students and • a motivator for low scoring students
Not a label for life...just another piece of information • The Chances graphs show that, from almost any baseline score, students come up with almost any grade - - -there are just different probabilities for each grade depending on the baseline score. • In working with students these graphs are more useful than a single predicted or target grade • Chances graphs show what can be achieved: • By students of similar ability • By students with lower baseline scores
Why is the ‘predicted’ grade not always equal to the highest bar ? Predicted (‘expected’) grade Most likely grade AT WHICH POINT WILL THE SEE-SAW BE BALANCED? Predicted (‘expected’) grade i.e. the lower grades ‘pull’ the prediction to the left
Key points to consider might include: • Where has the data come from? • What (reliable and relevant) data should we use? • Enabling colleagues to trust the data: Training (staff) • Communication with parents and students • Challenging, NOT Demoralising, students……. • Storage and retrieval of data • Consistency of understanding what the data means and does not mean