Download
1 / 88
880 likes | 999 Views
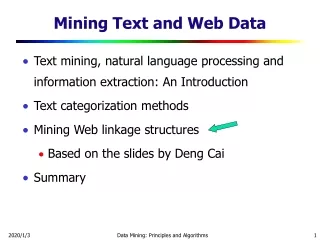
Web Log, Text, and Other Data Mining. Wayne Kao. What is Data Mining?. “Automated extraction of hidden predictive information from large databases” -Kurt Thearling

E N D
Web Log, Text, and Other Data Mining Wayne Kao
What is Data Mining? • “Automated extraction of hidden predictive information from large databases” -Kurt Thearling • “Quickly and thoroughly explore mountains of data, isolating the valuable, usable information -- the business intelligence” -SPSS site
Possible Questions (Chi) • Usage • How has info been accessed? How frequently? What’s popular? • How do people enter the site? Where do people spend time? How long do they spend there? • How do people travel within a site? What are the [un]popular paths? • Who are the people accessing the site? From what geographical location? From what domains?
Possible Questions (cont) • Structural • What information has been added? Modified? Remained the same but moved? • Usage + Structural • How is new info accessed? When does it become popular? • How does introducing new information change navigation patterns? Can people still navigate there to the desired info? • Do people look for deleted information?
Design Evaluate Prototype Usability Testing Common usability testing techniques: • Interviews • Ethnographic and/or lab-style observations • Surveys • Focus groups Good qualitative data Problems with these techniques: • Time and effort are costly • Small sample sizes – quantitative results? (Spool) How can we get usability testing more involved in the design cycles, so we can find problems and potential problems earlier?
Remote Usability (Waterson) • Analyze clickstreams in the context of the task and user intentions • Human observers not present • Want methods that are • Easy to deploy on any website • Compatible with range of OS and browsers • Mobile computing adds further usability challenges • Small screen sizes • Limited and/or new interaction techniques • Devices are used in environments beyond the desktop
Apache Web Log 205.188.209.10 - - [29/Mar/2002:03:58:06 -0800] "GET /~sophal/whole5.gif HTTP/1.0" 200 9609 "http://www.csua.berkeley.edu/~sophal/whole.html" "Mozilla/4.0 (compatible; MSIE 5.0; AOL 6.0; Windows 98; DigExt)" 216.35.116.26 - - [29/Mar/2002:03:59:40 -0800] "GET /~alexlam/resume.html HTTP/1.0" 200 2674 "-" "Mozilla/5.0 (Slurp/cat; slurp@inktomi.com; http://www.inktomi.com/slurp.html)“ 202.155.20.142 - - [29/Mar/2002:03:00:14 -0800] "GET /~tahir/indextop.html HTTP/1.1" 200 3510 "http://www.csua.berkeley.edu/~tahir/" "Mozilla/4.0 (compatible; MSIE 6.0; Windows NT 5.1)“ 202.155.20.142 - - [29/Mar/2002:03:00:14 -0800] "GET /~tahir/animate.js HTTP/1.1" 200 14261 "http://www.csua.berkeley.edu/~tahir/indextop.html" "Mozilla/4.0 (compatible; MSIE 6.0; Windows NT 5.1)“
Analog - One traditional tool • Reports number of requests, info about client machines, entry/exit points, charts (Chi et al.) • Generated on a daily basis • Typical stats • Prettier stats
Readings • “Visualizing the Evolution of Web Ecologies” Chi et al., Xerox PARC, 1998 • “Visualizing Association Rules for Text Mining”Wong, Whitney, & Thomas, Pacific Northwest, 1999 • “VISVIP: 3D Visualization of Paths through Web Sites”Cugini & Scholtz, National Institute of Standards and Technology, 1999 • “Case Study: E-Commerce Clickstream VisualizationBrainerd & Becker, Blue Martini Software, 2001 • “What Did They Do? Understanding Clickstreams with the WebQuilt Visualization System”Waterson et al., UC Berkeley, 2002
Readings • “Visualizing the Evolution of Web Ecologies” Chi et al., Xerox PARC, 1998 • “Visualizing Association Rules for Text Mining”Wong, Whitney, & Thomas, Pacific Northwest, 1999 • “VISVIP: 3D Visualization of Paths through Web Sites”Cugini & Scholtz, National Institute of Standards and Technology, 1999 • “Case Study: E-Commerce Clickstream VisualizationBrainerd & Becker, Blue Martini Software, 2001 • “What Did They Do? Understanding Clickstreams with the WebQuilt Visualization System”Waterson et al., UC Berkeley, 2002
Evolution of Web Ecologies • Rather than hits, focus intermediate representation on (C)ontent, (U)sage, and (T)opology, sorted by URL. • URL1: • {day1: <link> <link> …} • {day2: <link> <link> …} • URL2: • {day1: <link> <link> …} • Visualize an entire web site in a small amount of space • Show temporal changes
Disk Tree Visualization • Breadth first traversal • Each ring represents a tree level • All leaf nodes guaranteed some angular space (360 / # leaves)
Disk Tree Visualization (cont) • Pros • No occlusion problems since it’s 2D plane • Can use the 3rd dimension for other info (e.g. time) • Aesthetically pleasing to the eye (?) • Cons • Difficult to see any page-level detail • Confusing color choices
Time Tube Visualization • Put Disk Trees along spatial axis • Rotated so that each slice gets equal screen area • Focus+context • Animation: Can fly through tube, mapping time onto time
Interaction Model • Can rotate slices with a button click • Can focus a slice by clicking on it • Flicking gestures move slices around • Right-clicking zooms to an area • Mouseovers display more information about a node in a side window • Can bring up pages in the browser • Animation of slices
Real-world Analyzes • Deadwood: Shows pages becoming [un]popular • Shows effects of a redesign
Real-world Analyzes (cont) • Added items are being used • Deleted items aren’t negatively impacting the rest of the site
Comments • Gives only a broad view of the data with no real way to get at the specifics • Interaction seems very advanced • Not sure how intuitive the whole idea of a circular tree is – seems kind of gratuitous
Readings • “Visualizing the Evolution of Web Ecologies” Chi et al., Xerox PARC, 1998 • “Visualizing Association Rules for Text Mining”Wong, Whitney, & Thomas, Pacific Northwest, 1999 • “VISVIP: 3D Visualization of Paths through Web Sites”Cugini & Scholtz, National Institute of Standards and Technology, 1999 • “Case Study: E-Commerce Clickstream VisualizationBrainerd & Becker, Blue Martini Software, 2001 • “What Did They Do? Understanding Clickstreams with the WebQuilt Visualization System”Waterson et al., UC Berkeley, 2002
Association Rule? • Quantitative rule that describes associations between sets of items • Not qualitative because no domain knowledge necessary for text mining • Implication X Y where • X: set of antecedent items • Y: consequent item • Example: 80% of people who buy diapers and baby powder also buy baby oil.
Association Rule? (cont) • Support/predictability/conditional probability • Percentage of items in the total set that satisfies the union of items in the antecedent and in the consequent item • Confidence/prevalence/joint probability • Percentage of articles that satisfy both the antecendent and the consequent item
Association Rule Visualization • Must visualize • Antecedent items & consequent items • Associations between antecedent and consequent • Rules' support • Confidence • Traditional ways of visualizing it • 2D matrix • Directed graph
2D Matrix (figure 1) • Antecedent and consequent items on axes • Metadata icons in the cells that connect the antecedent to consequent contain support and confidence values Association rule: B C
2D Matrix (cont) • Pros: one-to-one binary relationships • Cons: • Hard to see association rules in many-to-one relationships (A+BC or AC and BC) • Grouping antecedents adds complexity • Object occulusion
Directed graph • nodes = items • edges = associations • Cons: • Dozen or more items tangled display • Selecting edges to display multiple rules requires significant human interaction
“Novel” Technique • Matrix: rule-to-item • rows = topics • columns = item associations • blue/red = antecedent and consequent • Bar graph = confidence/support • Can use queries to filter • Mouse zooming to support context/focus
“Novel” Technique Advantages • Handles hundreds of multiple antecedent association rules • View topics and associations simultaneously • Individual items clearly shown • No antecedent groups • Few occulusions because metadata is plotted at the far end and bar graph is scaled • No screen swapping, animation, or serious interaction required
“Novel” Technique Demo • Demo shows scalability • ~9 MB news article corpus of 100,000+ documents • Use word and concept-based text engines • Words evaluated on whether they’re interesting depending on their position in documents • Suffices removed and common prepositions, pronouns, adj’s, gerunds ignored • Build a table of antecedents, consequents, confidences, and supports -> feed into viz
Conclusions • Rule-to-item association • Very clear visualization if limited to a few dozen rules • Most web log visualizations jump to using a graph; this paper forces you to think twice.
Readings • “Visualizing the Evolution of Web Ecologies” Chi et al., Xerox PARC, 1998 • “Visualizing Association Rules for Text Mining”Wong, Whitney, & Thomas, Pacific Northwest, 1999 • “VISVIP: 3D Visualization of Paths through Web Sites”Cugini & Scholtz, National Institute of Standards and Technology, 1999 • “Case Study: E-Commerce Clickstream VisualizationBrainerd & Becker, Blue Martini Software, 2001 • “What Did They Do? Understanding Clickstreams with the WebQuilt Visualization System”Waterson et al., UC Berkeley, 2002
VISVIP • Captures individual movement between pages rather than aggregates • Shows paths - sequence of URLs
Topology • Directed graph • Force-directed algorithm • Spring-like force • Nodes repel each other with force inversely proportional to the distance between them (i.e. closer nodes means closer pages) • Final force pulls nodes toward center
Content • URLs abbreviated • http://sims.berkeley.edu/~bob/pics/large/abd.gif ge/abd • Color-coded by content type • Mouseover reveals all the abbreviated information
Simplification • Common problems • Noise nodes not significant to paths - image and mailto nodes • Over-connectivity - link back to home page or company logo • Solutions • Delete all edges connected to a node • Make one node the graph root • Focus on a subset of the graph
Path Sequence • Showing subject paths as straight lines didn't work • Hard to follow single jagged path • Multiple paths overlapped • Spline representation • Each path is a smooth curve overlaid on the graph • Colors for groups of subjects (e.g. novices)
Path Sequence (cont) • User path-oriented layouts • Simpler structure than when path is laid over a graph of the entire site
Path Timing • Vertical bar with base on node, its height proportional to time spent on page • Animation runs through pages at 10-30 times real-time • Select a node to get detailed stats
Comments • Capturing individual movements pretty innovative • Curved user paths and reorienting the layout based on user paths • Overall graph viz not too clear • Good tips for creating a web log mining viz
Readings • “Visualizing the Evolution of Web Ecologies” Chi et al., Xerox PARC, 1998 • “Visualizing Association Rules for Text Mining”Wong, Whitney, & Thomas, Pacific Northwest, 1999 • “VISVIP: 3D Visualization of Paths through Web Sites”Cugini & Scholtz, National Institute of Standards and Technology, 1999 • “Case Study: E-Commerce Clickstream VisualizationBrainerd & Becker, Blue Martini Software, 2001 • “What Did They Do? Understanding Clickstreams with the WebQuilt Visualization System”Waterson et al., UC Berkeley, 2002
Clickstream Visualizer • Aggregate nodes using an icon (e.g. all the checkout pages) • Edges represent transitions • Wider means more transitions
Customer Segments • Collect • Clickstream • Purchase history • Demographic data • Associates customer data with their clickstream (scary...) • Different color for each customer segment
Filtering • Using the mouse or table control, can filter by • Edge weight • Node selection • Example: select checkout nodes and see if users are exiting from nodes
Layout Using third party Tom Sawyer package • Hierarchical from higher-out degree to higher-in degree • Mirrors actual flow of site users • The default • Circular • Puts related nodes into circles • Shows relationships between groups of pages