Download
1 / 27
270 likes | 407 Views
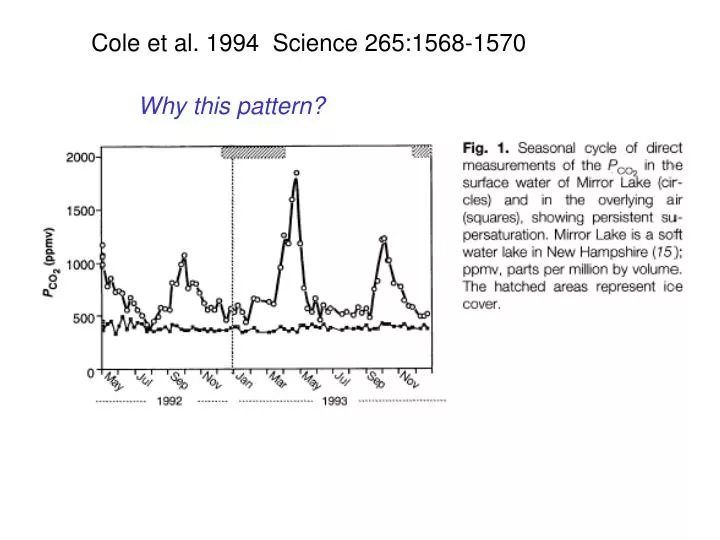
Cole et al. 1994 Science 265:1568-1570. Why this pattern?. Cole et al. 1994 Science 265:1568-1570. Directly measured. Autumn. Full Seasonal Data. Summer. Tropical Africs. Lec 6: Nutrients and Nutrient cycling. I. Storages and cycling II. Nutrient loading (more next lecture)

E N D
Cole et al. 1994 Science 265:1568-1570 Why this pattern?
Cole et al. 1994 Science 265:1568-1570 Directly measured Autumn Full Seasonal Data Summer Tropical Africs
Lec 6: Nutrients and Nutrient cycling I. Storages and cycling II. Nutrient loading (more next lecture) III. Phosphorus IV. Nitrogen V. Other elements 1
I. Storages and cycling A. Energy versus nutrients -Energy flows -Nutrients cycle B. Closed system 1. Rate = cycles/time a. as rate increases, productivity increases b. total N or P versus the amount of inorganically available N or P 2. Pathways - In a closed system all the nutrients cycle within the system C. Open system - Boundaries 1. Rate 2. Pathways (e.g. internal cycling vs. nutrient loading) 3. Residence time: time spent cycling before being lost from the system a. residence time = amount of nutrient in the system/amount in output b. in an open system nutrient use depends on recycling rate and retention by the system (residence time) c. inputs and outputs do not necessarily balance 2
II. Nutrient Loading • A. Estimates of critical amounts of nutrients for eutrophication (especially used for N and P) • B. Amount of nutrient input per time and lake area • called aerial loading • C. Used to develop models of nutrient effects in lakes • D. Must determine: • 1. Volume of inflow and outflow • 2. Concentration of nutrient in effluents and influents • 3. Volume of lake • 4. Loss rates to sediments 3
III. Phosphorus (P) A. Except under polluted conditions, the only significant inorganic form of Phosphorus is Orthophosphate (PO4–3) B. Phosphorus often is a limiting nutrient in freshwater habitats C. Generally, >90% of Phosphorus is in or adsorbed to living or dead organisms D. Phosphorus is unique among the major inorganic nutrients in that its oxidation is not an important energy source (P always occurs in the oxidized form) 4
III. A. P as a Limiting Nutrient Elemental composition in plants (w/ balanced growth) Presence in environment Composition of sewage effluents C : N :P 106:16:1 100-1000C:10N:1P 6C:4N:1P 2nd to become limiting 1st to become limiting ** Luxury Uptake rarely limiting 5
III. B. Phosphorus Cycle • Weathering of Rock (Apatite) • P adsorbs to particles 6
III. C. Forms of Phosphorus A. Particulate P 1. Organisms 2. Rocks, soil, sediments Igneous rocks are associated with low P Sedimentary rocks are associated with high P 3. Adsorbed B. Dissolved P 1. Orthophosphate (PO4–3) 2. Polyphosphates (from detergents) 3. Organic phosphates (mostly colloidal) Total Phosphorus must take into account all forms of P, including that incorporated into suspended matter and organisms. 7
III. D. Sources of Phosphorus A. Precipitation (Wet and Dry) Non-populated areas <30 ug/L Urban-Industrial areas >100 ug/L Range 0.01-0.1 g/m2/year B. Ground Water 20 ug/L C. Runoff (fertilizers) varies Lake requirements ~ 0.07 g/m2/year: >0.13 g/m2/year may result in eutrophication if mean depth < 5m 8
Photic Zone Aphotic Zone III. E. Distribution of Phosphorus In epilimnion, P rapidly is taken up by algae Phosphate in living plant and animal tissue Compensation Thermocline Depth Phosphate In sediments, P is removed by rooted vegetation and benthos dissolved in water 9 Phosphate in mud
O O o o P, P, C, O C, O 2 2 Generalized P Profiles in Lakes of Low and High Productivity OLIGOTROPHIC EUTROPHIC P S P T P O O S P 2 2 T Depth Depth PT = Total phosphorus PS = Soluble phosphorus 10
Phosphorus in Sediments • Depends on O2 supply • O2 depends on trophic status and basin morphology • P is retained by the oxidized microzone • Breakdown of the oxidized microzone releases P (also Fe, Mn) • P, Fe, and Mn concentrations are related • P released from sediments under anoxic conditions (+ feedback of internal cycling) • P also may be released from sediments by rooted vegetation and benthos 11
III. F. Epilimnetic Phosphorus and Lake Productivity P generally is regarded as more important than other nutrients except in marine costal waters and under high P conditions. ProductivityTotal P Ultraoligotrophic <5 ug/L Oligo-Mesotrophic 5-10 Meso-Eutrophic 10-30 Eutrophic 30-100 Hypereutrophic >100 *Note areal loading rate; influence of depth 12
TP TN TN:TP Jan 2004 80 10.00 60 1.00 40 N:P Ratio TN or TP (mg/L) 0.10 20 0 0.01 MIC010 PEC010 NEC010 FRR010 FRR020 FRR030 FRR040 FRR050 FRR060 FRR070 FRR080 FRR090 FRR100 FRR110 CHC010 CRC010 CGC010 CGC020 CGC030 CGC040 HEL010 1m HEL010 4m HEL020 1m HEL020 3m HEL030 1m HEL030 4m HEL040 1m HEL040 4m Hensley Reservoir and Fresno River Data Generalized relationship between water clarity (Secchi depth) and algal concentration (Chl a). (OECD 1982).
III. G. Phosphorus and Water Quality A. P levels often positively correlated with aquatic productivity B. Noxious algal blooms C. Hypolimnetic Oxygen Deficits D. P is difficult to remove from water 13
P Loading & Phytoplankton (Lake Washington, Seattle) P Loading & Oxygen Hypolimnetic O2 deficit 14
IV. Nitrogen A. Generally considered to be the 2nd most important nutrient in lakes in terms of limiting the rate of primary production (Phosphorus being 1st) B. Occurs in many forms and energy states (gas, organic and inorganic) Lithosphere 97.6% Atmosphere 2.3% Hydrosphere + Biosphere 0.1% C. Important both as a nutrient and (in some forms) for its toxicity to organisms 15
IV. A. Forms of Nitrogen • A. Dissolved molecular Nitrogen (N2) • B. Organic Nitrogen • Proteins Highest Energy • Amino acids • Amines • Humic compounds • C. Inorganic Nitrogen • NH4+ Ammonium • NO2– Nitrite • NO3– Nitrate Lowest Energy 16
IV. B. Nitrogen Sources and Losses • A. Sources • 1. Precipitation (wet & dry) • 2. Nitrogen Fixation • 3. Runoff • B. Losses • 1. Outflow • 2. Denitrification (NO3 => N2) • 3. Sediments 17
IV. B. Nitrogen Fixation A. N2 gas to ammonium, very expensive energetically (Chemical “fixation” of molecular nitrogen (breaking the triple covalent bond) in the laboratory requires 500OC and 100+ atmospheres of pressure) B. Only bacteria known to fix nitrogen C. Nitrogenase sensitive to O2, a variety of adaptations protect it D. Lightning also fixes N2 to NO3- in the atmosphere E. Nitrogen-fixing cyanobacteria can be very important in lake N cycles 18
IV. C. N Cycling A. Nitrification- oxidation of ammonium to nitrite (Azotobacter) and nitrite to nitrate (Nitrobacter) B. Denitrification- using NO3- as an electron acceptor for oxidation of carbon, yields N2O and N2. Drives N loss from environment. Under very low redox, can go to ammonium C. Remineralization (ammonification) OrgN => NH4+ 19
IV. D. N Distribution in a Lake Nitrate (NO3) Ammonium (NH3) 20
O O o o N, C, O N, C, O 2 2 Generalized N Profiles in Lakes of Low and High Productivity OLIGOTROPHIC EUTROPHIC – – NO + NO O 3 NH 3 2 + 4 NH 4 O 2 Depth Depth 21
pH NH4+ : NH4OH 6 3000:1 7 300:1 8 30:1 9.5 1:1 Least toxic Most toxic IV. E. Toxic Forms of Nitrogen • A. Nitrate/Nitrite – concentrations in drinking water >10 mg/l can cause the disease Methemoglobinemia • in infants (a problem in some agricultural areas) (NO2 binds to hemoglobin more strongly than O2) -Can be converted to carcinogenic nitrosamines in the stomach • B. Ammonia (especially in the form NH4OH) is toxic to many organisms • Amount of NH4+vs. NH4OH is pH dependent: 22
V. Silicon, Iron, etc. A. Silicon 1. Key element in diatom frustules 2. Can become limiting in lakes B. Iron 1. Ferric, Fe3+, oxidized; ferrous, Fe2+ reduced 2. Iron oxidation by microorganisms important chemoautotrophic pathway, but also will happen abiotically, so must occur at oxic/anoxic interface 3. Oxidized iron precipitates with phosphate, but dissociates again in anoxic conditions 23