Download
1 / 16
160 likes | 309 Views
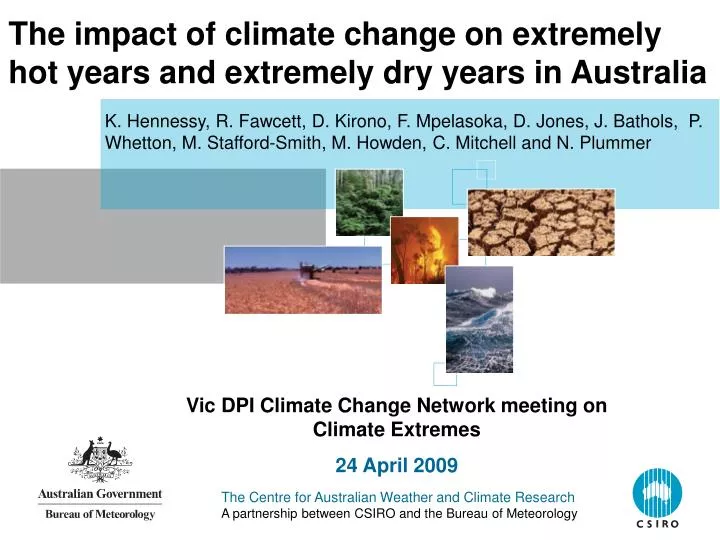
The impact of climate change on extremely hot years and extremely dry years in Australia. K. Hennessy, R. Fawcett, D. Kirono, F. Mpelasoka, D. Jones, J. Bathols, P. Whetton, M. Stafford-Smith, M. Howden, C. Mitchell and N. Plummer. Vic DPI Climate Change Network meeting on Climate Extremes

E N D
The impact of climate change on extremely hot years and extremely dry years in Australia K. Hennessy, R. Fawcett, D. Kirono, F. Mpelasoka, D. Jones, J. Bathols, P. Whetton, M. Stafford-Smith, M. Howden, C. Mitchell and N. Plummer Vic DPI Climate Change Network meeting on Climate Extremes 24 April 2009
Overview The Australian Government is undertaking a Review of Drought Policy, involving three assessments • Impacts of climate change on exceptional climatic events • Economic impacts • Social impacts “An assessment of the impact of climate change on the nature and frequency of exceptional climatic events” was published by CSIRO and the Bureau of Meteorology • Recent climatic trends • Methodology • Projected changes in exceptional climatic events • Conclusions The Centre for Australian Weather and Climate ResearchA partnership between CSIRO and the Bureau of Meteorology
Observed trends in Australian climate Since 1950, there has been a 0.9oC warming, with more heat waves, fewer frosts, more rain in north-western Australia, less rain in southern and eastern Australia, and sea level has risen 70 mm The Centre for Australian Weather and Climate ResearchA partnership between CSIRO and the Bureau of Meteorology
Very dry over southeast Qld, southern NSW and SA, Victoria, eastern Tas and southwest WA The past 12 years have been unusual Very wet in the north and west The Centre for Australian Weather and Climate ResearchA partnership between CSIRO and the Bureau of Meteorology
Causes of Australian climate change • Most of the warming since 1950 is very likely due to increases in greenhouse gases • There is uncertainty about the causes of rainfall trends • Increases in the northwest may be due to natural variability and a shift in monsoon rainfall due to increases in Asian aerosols • Decreases in the south are due to a southward shift in weather systems, associated with an increase in atmospheric pressure. In the south-west this is likely due to natural variability and increases in greenhouse gases (may also apply to drying in the south-east) • Decreases in the east are mainly due to an increase in El Niños since 1975, the cause of which is being investigated The Centre for Australian Weather and Climate ResearchA partnership between CSIRO and the Bureau of Meteorology
Methodology • Terms of Reference asked us to focus on changes in exceptionally* high temperatures, low rainfall and low soil moisture over the next 20-30 years over large regions • We defined 7 study regions • Historical and projected changes in • annual-average rainfall and temperature • area and frequency of exceptionally hot years (annual-mean temperatures above the 95th percentile for 1900-2007) • area and frequency of exceptionally dry years (annual total rainfall or soil moisture below the 5th percentile) The 7 study regions * a 1 in 20-25 year event The Centre for Australian Weather and Climate ResearchA partnership between CSIRO and the Bureau of Meteorology
Model simulations • Model selection • Availability of monthly temperature, rainfall and potential evaporation data from 1900-2040 • Simulations driven by observed radiative forcing (including GHG and aerosols) for 1900-2000, and IPCC A1B (or A2) emissions scenarios for 2001-2040 • Good performance in the Australian region • RMS errors and pattern correlations between observed and simulated seasonal-mean temperature, rainfall and MSLP (mean climate test) • Regressions between observed and simulated exceptionally hot or exceptionally dry years (extreme climate trend test) • 13 models were selected The Centre for Australian Weather and Climate ResearchA partnership between CSIRO and the Bureau of Meteorology
Exceptionally hot years Average percentage area having exceptionally hot years for selected 40-year periods Over the last 40 years, exceptionally hot years are typically occurring over 10-12% of each region, which is double the expected long-term average of 5% The Centre for Australian Weather and Climate ResearchA partnership between CSIRO and the Bureau of Meteorology
Exceptionally dry years Average percentage area having exceptionally low rainfall years for selected 40-year periods and the most recent decade (1998-2007) Trends are highly dependent on the period of analysis due to large variability between decades The Centre for Australian Weather and Climate ResearchA partnership between CSIRO and the Bureau of Meteorology
Observations Multi model means 10-90th %-ile range Exceptionally hot years Percentage area experiencing an exceptionally hot year: Queensland as an example The Centre for Australian Weather and Climate ResearchA partnership between CSIRO and the Bureau of Meteorology
Exceptionally hot years Simulated percentage area having exceptionally hot years for 1900-2007 and 2010-2040, based on 13 climate models. The low and high scenarios represent the lowest and highest 10% of the range of model results Area affected in each region increases from about 4.5% (1900-2007) to 60-80% (2010-2040) The return period decreases from about 22 years (1900-2007) to 1-2 years (2010-2040) The Centre for Australian Weather and Climate ResearchA partnership between CSIRO and the Bureau of Meteorology
Exceptionally dry years Area affected in each region increases from about 5.5% (1900-2007) to 6-10% (2010-2040) in most regions The mean return period decreases from about 18 years (1900-2007) to 16-18 years (2010-2040) in most regions (around 13 years in SW and Vic&Tas, 6.5 years in SW WA) The Centre for Australian Weather and Climate ResearchA partnership between CSIRO and the Bureau of Meteorology
Exceptionally low soil moisture • Percentage area below 5th percentile – annual soil moisture (1957-2006) • calculated using the SIMHYD model • prior to 1957, potential evap data are unreliable Area affected in each region increases from about 6.5% (1957-2006) to 7-11% (2006-2055) in most regions The mean return period decreases from about 16 years (1957-2006) to 12-14 years (2006-2055) in most regions The Centre for Australian Weather and Climate ResearchA partnership between CSIRO and the Bureau of Meteorology
Conclusions • The frequency and severity of exceptional climatic events: • The areal extent and frequency of exceptionally hot years have been increasing over recent decades • Over the period 2010-2040, years currently considered exceptionally hot are likely to occur every one to two years • Historical trends in the extent and frequency of exceptionally dry years are highly dependent on the period of analysis due to large variability between decades • Over the period 2010-2040, years currently considered exceptionally dry are likely to occur over larger areas more often in the SW, SW WA and Vic& Tas regions, with little change in the other regions • Policy relevance • This study suggests that the existing 1 in 20-25 year trigger for exceptional circumstances drought support is not appropriate under a changing climate The Centre for Australian Weather and Climate ResearchA partnership between CSIRO and the Bureau of Meteorology
The CSIRO & BoM Report http://www.daff.gov.au/agriculture-food/drought/national_review_of_drought_policyhttp://www.bom.gov.au/climate/droughtec/ The Centre for Australian Weather and Climate ResearchA partnership between CSIRO and the Bureau of Meteorology
Model performance Observed and simulated trends in exceptionally low rainfall are not significantly different, in general, based on quadratic polynomial regressions for the period 1900–2007. Values less than 5% (red) do represent significant differences between observed and simulated trends. M skill score 0.518 0.478 0.601 0.607 0.564 0.515 0.639 0.627 0.505 0.608 0.608 0.601 0.677 The Centre for Australian Weather and Climate ResearchA partnership between CSIRO and the Bureau of Meteorology