Download
1 / 40
410 likes | 559 Views
EX/1-1. The performance of improved H-modes at ASDEX Upgrade and projection to ITER George Sips MPI für Plasmaphysik, EURATOM-Association, D-85748, Germany

E N D
EX/1-1 The performance of improved H-modes at ASDEX Upgrade and projection to ITER George Sips MPI für Plasmaphysik, EURATOM-Association, D-85748, Germany G. Tardini1, C. Forest2, O. Gruber1, P. Mc Carthy3, A. Gude1, L.D. Horton1, V. Igochine1, O. Kardaun1,C.F. Maggi1, M. Maraschek1, V. Mertens1, R. Neu1, A. Peeters1, G. V. Pereverzev1, A. Stäbler1, J. Stober1,W. Suttrop1 and the ASDEX Upgrade Team. 1 Max-Planck-Institut für Plasmaphysik, EURATOM-Association, D-85748, Germany. 2The University of Wisconsin, Madison, USA. 3Dep. of Physics, University College Cork, Association EURATOM-DCU, Cork, Ireland. George Sips21st IAEA Fusion Energy Conference, Chengdu, China, 16-21 October 2006
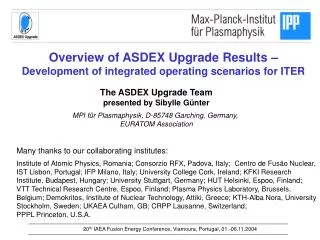
Motivation: ITER performance ITER primary goal: Q=10, Pfus~400MW. Energy confinement:IPB98(y,2) scaling expression. ITER size, 15MA/5.3T, Paux≤ 73 MW, <ne>=0.85,…. bN=1.8 Mukhovatov V. et al Nucl. Fusion 43 (2003) 942 George Sips21st IAEA Fusion Energy Conference, Chengdu, China, 16-21 October 2006
Motivation: ITER performance • Integrated simulation codes: ‘envelope’ of performance. • Strong dependence, of Q and Pfus with H98(y,2). • Significant increase in ITER performance for ‘small’ increase in energy confinement. bN>2 bN=1.8 Mukhovatov V. et al Nucl. Fusion 43 (2003) 942 George Sips21st IAEA Fusion Energy Conference, Chengdu, China, 16-21 October 2006
Motivation: ITER performance • Integrated simulation codes: ‘envelope’ of performance. • Strong dependence, of Q and Pfus with H98(y,2). • Significant increase in ITER performance for ‘small’ increase in energy confinement. • H98(y,2) > 1, and bN> 2: • Higher performance at 15 MA. • Long pulse operation, Ip=11 to 14 MA, with Q=5-10 (Hybrid). • DEMO: H98(y,2) ≥ 1.2, bN≥3.5. bN>2 bN=1.8 Mukhovatov V. et al Nucl. Fusion 43 (2003) 942 George Sips21st IAEA Fusion Energy Conference, Chengdu, China, 16-21 October 2006
Motivation Outline • ASDEX Upgrade: Improved H-modes (H98(y,2) > 1, and bN> 2). • Operational range: - wide range in density, Ti0/Te0 and n*. - at q95→ 3.1. - high beta: Limits and control of NTMs. • Scaling to ITER using experimental data. • Conclusions. George Sips21st IAEA Fusion Energy Conference, Chengdu, China, 16-21 October 2006
1.6 ASDEX Upgrade H-mode data 1.4 1.2 H98(y,2) 1.0 ITER 0.8 0.6 1 2 3 H-modes with Type I ELMs bN ASDEX Upgrade: H-mode data • H-mode operation for a wide range of plasma conditions: • Ip=0.6-1.4MA, BT=1.6-3.0T. • All type I ELMy H-modes: • q95 < 5.5, stationary > 0.2 s. • (values shown are averaged) George Sips21st IAEA Fusion Energy Conference, Chengdu, China, 16-21 October 2006
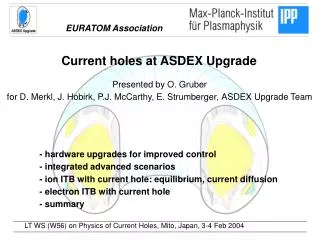
Ip=300 kA Ip=540 kA Ip=700 kA Ip=0.8-1.2 MA z(m) z(m) z(m) z(m) 1.0 1.0 1.0 1.0 0 0 0 0 -1.0 -1.0 -1.0 -1.0 W C R(m) R(m) R(m) R(m) 1.0 1.5 2.0 1.0 1.5 2.0 1.0 1.5 2.0 1.0 1.5 2.0 W C W C W C heating 0.1 0.4 0.6 >1.0 time (s) Current rise phase Low magnetic shear Current rise: 1. Early divertor configuration t~0.5s. 2. low <ne> ~ 3x10¹⁹ m-3, control of impurities. 3. Additional heating: Slow down the current penetration. Low magnetic shear in the centre. George Sips21st IAEA Fusion Energy Conference, Chengdu, China, 16-21 October 2006
Low magnetic shear Improved H-mode q95= 4.8 ASDEX Upgrade: Equilibrated q-profiles 5 ~ zero magnetic shear ←q 4 3 2 1 1 shear/q → 0 0 0.2 0.4 0.6 0.8 0 rtor • MSE data available in 2006. • Timing of preheating: ‘control’ of q-profile H98(y,2). • The q-profile remains flat in the core. McCarthy P. et al, EX/P3-7 Stober J. et al, EX/P1-7 George Sips21st IAEA Fusion Energy Conference, Chengdu, China, 16-21 October 2006
(3,2) NTM activity Fishbone activity Low magnetic shear Improved H-mode q95= 4.8 ASDEX Upgrade: Equilibrated q-profiles 5 ~ zero magnetic shear ←q 4 3 2 1 1 shear/q → 0 0 0.2 0.4 0.6 0.8 0 rtor • MSE data available in 2006. • Timing of preheating: ‘control’ of q-profile H98(y,2). • The q-profile remains flat in the core. MHD modes main candidate. • Typically (3,2) NTMs and higher (m,n) activity or fishbone activity. George Sips21st IAEA Fusion Energy Conference, Chengdu, China, 16-21 October 2006
ASDEX Upgrade, all improved H-modes 1.6 1.4 1.2 H98(y,2) 1.0 ITER 0.8 0.6 Improved H-modes 1 2 3 bN ASDEX Upgrade: Improved H-mode data • A second dataset includes all“improved H-mode” discharges: • Early heating (some selected cases with late heating). • Stationary for > 0.5 s. • NOT just a selection of the best discharges. Minimum valuesrequired for DEMO George Sips21st IAEA Fusion Energy Conference, Chengdu, China, 16-21 October 2006
ASDEX Upgrade 1.6 1.4 1.2 H98(y,2) 1.0 ITER 0.8 Improved H-modes H-modes (Type I) 0.6 1 2 3 bN ASDEX Upgrade: Improved H-mode data Improved H-modes do not exclusively occupy the domain H98(y,2) > 1 at βN= 2-3. Any H-mode, when it manages to achieve high beta is likely to develop low central shear in the centre, due to bootstrap current (overlap of ‘grey’ and ‘red’ data). Physics criteria for improved H-modes would depend on the details of the current density profile (not routinely available). George Sips21st IAEA Fusion Energy Conference, Chengdu, China, 16-21 October 2006
ASDEX Upgrade: Improved H-mode data Various physics studies on the reason for the high stability/ confinement in improved H-modes. Core: Stober J. et al, EX/P1-7 Pedestal: Suttrop W. et al, EX/8-5 Maggi C. et al, IT/P1-6(various experiments) Similar results have been obtained in other experiments (DIII-D, JET, JT-60U, NSTX..), for a range of conditions (See this conference !!). George Sips21st IAEA Fusion Energy Conference, Chengdu, China, 16-21 October 2006
Operational range: Density Improved H-modes:Typically operate at low density, <ne>/nGW = 0.35-0.6. After formation of q(r), the density can be increased together with an increase in heating power and d. <ne>/nGW = 0.85, H98(y,2) ~ 1.2 are obtained at high d=0.4.→At 1MA: <ne>=1.1x 10²⁰ m-3. → Tolerable ELMs. George Sips21st IAEA Fusion Energy Conference, Chengdu, China, 16-21 October 2006
NBI only NBI+ICRH Operational range: Ti0/Te0 ASDEX Upgrade improved H-modes 1. Operation at high <ne>. 2. ICRH and NBI at low <ne>. 0.7 < Ti0/Te0 < 2.5 Ti0/Te0 ~ 1 for a substantial subset of the data, while maintaining high confinement. Moreover, some of these discharges have low plasma rotation (low momentum input). 2.5 2.0 1.5 Ti0/Te0 1.0 0.5 0.0 0.2 0.4 0.6 0.8 1.0 <ne>/nGW George Sips21st IAEA Fusion Energy Conference, Chengdu, China, 16-21 October 2006
Operational range: n* Strongest correlation of maximum H98(y,2) with plasma collisionality (n*/n*ITER). Also density peaking (ne0/<ne>) can be higher at lower n*/n*ITER. b and v* dependence of the IPB98(y,2) scaling expression are under investigation. Weisen H. et al, EX/8-4 McDonald D. et al, EX/P3-5 George Sips21st IAEA Fusion Energy Conference, Chengdu, China, 16-21 October 2006
Operational range: low q95=3.17 # 20449 • 1.2MA/2.0T q95 = 3.17, • NBI used with beta feedback,50% of NBI is off-axis! • Central ICRF heating. • <ne>=6.4x10¹⁹m-3, Ti0/Te0=1.4 <ne>/nGW=0.42, n*/n*ITER=2. • H98(y,2) rises to 1.4 at bN=2.9. • CW,core = 2.5x10⁻⁵ (< 10-4). 1.2 Ip (MA) Da 0 8 PNBI (MW) PICH (MW) 0 even n odd n 3 bN 1 H98(y,2) 0 0 2 4 6 time (s) George Sips21st IAEA Fusion Energy Conference, Chengdu, China, 16-21 October 2006
Operational range: low q95=3.17 # 20449 • 1.2MA/2.0T q95 = 3.17, • NBI used with beta feedback,50% of NBI is off-axis. • Central ICRF heating. • <ne>=6.4x10¹⁹m-3, Ti0/Te0=1.4 <ne>/nGW=0.42, n*/n*ITER=2. • H98(y,2) rises to 1.4 at bN=2.9. • CW,core = 2.5x10⁻⁵ (< 10-4). • Core MHD: • (1,1) fishbones. • (4,3) NTMs. • NO sawteeth. • Early (3,2) NTM when bN ~2. 1.2 Ip (MA) Da 0 8 PNBI (MW) PICH (MW) 0 even n odd n 3 bN 1 H98(y,2) 0 0 2 4 6 time (s) George Sips21st IAEA Fusion Energy Conference, Chengdu, China, 16-21 October 2006
Operational range: ECCD, stabilise (3,2) NTM 1. ECCD: Stabilise this (3,2) NTM at q95~3.1 After ECCD, discharge continues as improved H-mode (shown before). Zohm H. et al, EX/4-1Rb • 2. Otherwise (2,1) NTM may develop, and disruption recognition algorithms will act: (mode-lock, radiation peaking, regime identification, neural net): • React by issuing a soft stop or triggering killer gas injection. Pautasso G. et al, EX/P8-7 3. Stabilisation of (3,2) NTM is not required for improved H-modes with q95 > 4. at q=1.5 position Stober J. et al, EX/P1-7 George Sips21st IAEA Fusion Energy Conference, Chengdu, China, 16-21 October 2006
Scaling to ITER using experimental data • Motivation: • Integrated simulation codes rely on use of transport models and models for actuators, require benchmarking on current experiments. • Scaling the measured kinetic profiles to ITER: 100% fit to experimental data, gradient length preserved, pedestal. • Use experimental profile shapes. • Same bN, H-factor's. • Use ITER geometry. • Impurities: Be 2 %, Ar 0.12 %, He 4.3 % (nD+nT)/ne ~ 0.8. • Assemble set of discharges with good profile measurements. • ITER predictions: Pfus, Paux, Q (+ other parameters using ASTRA). Luce T. et al 2004 Phys. Plasmas 11 2627 Tardini G. et al 33rd EPS Conference, Rome 19-23 June 2006, P1.112 George Sips21st IAEA Fusion Energy Conference, Chengdu, China, 16-21 October 2006
Scaling to ITER Scaling to ITER using experimental data Density: Use shape of ne profile from ASDEX Upgrade, set <ne> = 0.85nGW. Temperatures: Use shape of Ti profile or use shape of Te profile from ASDEX Upgrade (select highest), set Ti =Te and bNITER=bNAUG. George Sips21st IAEA Fusion Energy Conference, Chengdu, China, 16-21 October 2006
Scaling to ITER: q95=3.0, bN=2.1, high <ne> 14 30 bN,thITER = bN,thAUG ne 12 Ti = Te 25 10 ne (x1019 m-3) - ITER 20 Ti,e (keV) - ITER 8 15 6 10 4 5 2 0 0 0.0 0.5 1.0 1.5 2.0 0.0 0.5 1.0 1.5 2.0 rmin (m) rmin (m) Density: Use shape of ne profile from ASDEX Upgrade, set <ne> = 0.85nGW. Temperatures: Use shape of Ti profile or use shape of Te profile from ASDEX Upgrade (select highest), set Ti =Te and bNITER=bNAUG. George Sips21st IAEA Fusion Energy Conference, Chengdu, China, 16-21 October 2006
Scaling to ITER: q95=3.0, bN=2.1, high <ne> 14 30 bN,thITER = bN,thAUG ne ITER Scenario 2 12 Ti = Te 25 10 ne (x1019 m-3) - ITER 20 Ti,e (keV) - ITER 8 15 6 10 4 ITER Scenario 2 5 2 0 0 0.0 0.5 1.0 1.5 2.0 0.0 0.5 1.0 1.5 2.0 rmin (m) rmin (m) • Comparison with integrated ITER scenario modelling (Scenario 2): • Density:Assumed flat. • Temperatures: Set pedestal, models for core transport & heating systems. George Sips21st IAEA Fusion Energy Conference, Chengdu, China, 16-21 October 2006
14 30 bN,thITER = bN,thAUG ne 12 Ti = Te 25 10 20 ne (x1019 m-3) - ITER Ti,e (keV) - ITER nD+nT 8 15 6 10 4 5 2 0 0 0.0 0.5 1.0 1.5 2.0 2.0 0.0 0.5 1.0 1.5 rmin (m) rmin (m) Scaling to ITER: q95=3.17, bN=2.9 ITER Scenario 2 ITER Scenario 2 • At higher bN (Improved H-mode): • Temperature profiles rise over whole plasma region. • Consistent with observations of increased edge pedestal. Suttrop W. et al, EX/8-5Maggi C. et al, IT/P1-6 George Sips21st IAEA Fusion Energy Conference, Chengdu, China, 16-21 October 2006
Prediction of fusion performance in ITER 4 typical cases: ITER predictions at <n>/nGW=0.85 1200 Q= 1000 800 Q=8 Q=11.4 Pfus (MW) 600 ITER 15 MA Q=6.5 400 200 Open symbols Paux > 73 MW* Closed symbols Paux≤ 73 MW* 0 10 11 12 13 14 15 Ip– ITER (MA) *Paux based on using IPB98(y,2) scaling. George Sips21st IAEA Fusion Energy Conference, Chengdu, China, 16-21 October 2006
ITER predictions at <n>/nGW=0.85 1200 1000 bN,th = 2-3 800 Pfus (MW) 600 ITER 15 MA 400 bN,th ≤ 2.0 200 Open symbols Paux > 73 MW* Closed symbols Paux≤ 73 MW* 0 10 11 12 13 14 15 Ip– ITER (MA) Prediction of fusion performance in ITER • Operation at bN,th =2-3: • Significant fusion power for Ip=9.5MA to Ip=12MA. With bootstrap current fraction fBS~0.4 , and Q=6-15. Long pulse lengths (> 400s). • At low q95~3 (Ip=14-15 MA) would in principle be able to reach Pfus~1GW, Q=∞. *Paux based on using IPB98(y,2) scaling. George Sips21st IAEA Fusion Energy Conference, Chengdu, China, 16-21 October 2006
Prediction of fusion performance in ITER Petty G. et al 2003Fusion Sci. Technol. 43 1 Cordey J. G. et al 2005Nucl. Fusion 45 1078 ITER Physics Basis 1999 Nucl. Fusion 39 2137 • Q and input power (Paux) required (ASDEX Upgrade profile data): • Calculated for three different energy confinement scaling expressions. • Using IPB98(y,2): In some high b cases : Paux > 73MW. • Ip <11MA, despite H98(y,2)~1.4. George Sips21st IAEA Fusion Energy Conference, Chengdu, China, 16-21 October 2006
Conclusions • ASDEX Upgrade: • H-modes with low magnetic shear in the centre: H98(y,2) > 1 and bN=2-3.5. • Operation at high density and Ti0/Te0 ~ 1 is demonstrated. • Highest H98(y,2) values are achieved at ITER relevant n*. • At q95=3.1: H98(y,2)=1.4, bN=2.9, fishbone activity keeps q(r) stationary. • ECCD can be used to stabilise (3,2) NTM activity (q95~3). • ITER predictions, scaling kinetic profile shapes : <ne>=0.85nGW , keep bN,th. • At q95=3.1: Pfus=1070 MW, Q=∞. • At Ip=9.5-12MA: Pfus 300-600 MW, Q=6-15 (some cases Paux>73 MW). George Sips21st IAEA Fusion Energy Conference, Chengdu, China, 16-21 October 2006
Back-up slides George Sips21st IAEA Fusion Energy Conference, Chengdu, China, 16-21 October 2006
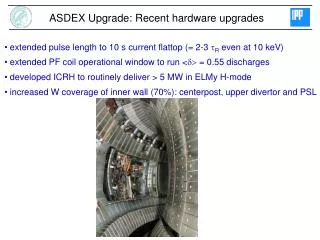
Operation: Tungsten coverage 85% All H-modes require central ICRH or ECRH to avoid impurity accumulation. Operation at <ne> ~ 4-6x10¹⁹ m-3 requires a boronisation to minimise tungsten influxes. Gruber O. et al, OV/2-3 Dux R. et al, EX/3-3Ra George Sips21st IAEA Fusion Energy Conference, Chengdu, China, 16-21 October 2006
Operational range: Density, n* Strongest correlation of maximum H98(y,2) with plasma collisionality (n*/n*ITER). Also density peaking (ne0/<ne>) can be higher at lower n*/n*ITER. b and v* dependence of the IPB98(y,2) scaling expression are under investigation. McDonald D. et al, EX/P3-5 George Sips21st IAEA Fusion Energy Conference, Chengdu, China, 16-21 October 2006
80 ELMs 60 40 (4,3) NTMs 20 fishbone activity 0 5.00 5.02 5.04 5.06 time (s) Operational range: low q95=3.17 Core MHD activity F (kHz) Soft X-ray data George Sips21st IAEA Fusion Energy Conference, Chengdu, China, 16-21 October 2006
Use of ECCD to stabilise (3,2) NTM Zohm H. et al, EX/4-1Rb George Sips21st IAEA Fusion Energy Conference, Chengdu, China, 16-21 October 2006
14 30 Ti , Te (Ti+Te)/2 12 ne 25 10 ne (x1019 m-3) - ITER 20 Ti,e (keV) - ITER 8 nD+nT 15 6 10 4 5 2 0 0 0.0 0.5 1.0 1.5 2.0 0.0 0.5 1.0 1.5 2.0 rmin (m) rmin (m) ITER Scenario 2 ITER Physics Basis 1999 Nucl. Fusion 39 2137 George Sips21st IAEA Fusion Energy Conference, Chengdu, China, 16-21 October 2006
Scaling to ITER: q95=3.0, bN=2.1, high <ne> 14 30 bN,thITER = bN,thAUG ne ITER Scenario 2 12 Ti = Te 25 10 ne (x1019 m-3) - ITER 20 Ti,e (keV) - ITER 8 nD+nT 15 6 10 4 ITER Scenario 2 5 2 0 0 0.0 0.5 1.0 1.5 2.0 0.0 0.5 1.0 1.5 2.0 rmin (m) rmin (m) George Sips21st IAEA Fusion Energy Conference, Chengdu, China, 16-21 October 2006
14 30 bN,thITER = bN,thAUG ne 12 Ti = Te 25 10 20 ne (x1019 m-3) - ITER Ti,e (keV) - ITER nD+nT 8 15 6 10 4 5 2 0 0 0.0 0.5 1.0 1.5 2.0 2.0 0.0 0.5 1.0 1.5 rmin (m) rmin (m) Scaling to ITER: q95=3.17, bN=2.9 ITER Scenario 2 ITER Scenario 2 George Sips21st IAEA Fusion Energy Conference, Chengdu, China, 16-21 October 2006
14 30 ne bN,thITER = bN,thAUG 12 Ti = Te 25 10 ne (x1019 m-3) - ITER 20 Ti,e (keV) - ITER nD+nT 8 15 6 10 4 5 2 0 0 0.0 0.5 1.0 1.5 2.0 0.0 0.5 1.0 1.5 2.0 rmin (m) rmin (m) Scaling to ITER: q95=3.8, bN=2.6 ITER Scenario 2 ITER Scenario 2 George Sips21st IAEA Fusion Energy Conference, Chengdu, China, 16-21 October 2006
Scaling to ITER: q95=4.6, bN=2.4 14 30 bN,thITER = bN,thAUG ITER Scenario 2 12 Ti = Te 25 10 ne (x1019 m-3) - ITER 20 Ti,e (keV) - ITER ne 8 15 6 nD+nT 10 4 ITER Scenario 2 5 2 0 0 0.0 0.5 1.0 1.5 2.0 0.0 0.5 1.0 1.5 2.0 rmin (m) rmin (m) George Sips21st IAEA Fusion Energy Conference, Chengdu, China, 16-21 October 2006
Prediction of fusion performance in ITER profile shapes George Sips21st IAEA Fusion Energy Conference, Chengdu, China, 16-21 October 2006
Prediction of fusion performance in ITER ITER predictions at <n>/nGW=0.85 Calculated bootstrap fraction fBS increases at lower current. ITER (15MA) ~ 0.18. Maximum of cases presented here: fBS ~ 0.4. A current ramp to lower plasma currents compared to reference design AND the ability to operate at same stored energy. longer pulse length. 1200 IBS/Ip 1000 = 0.25 = 0.30 800 = 0.35 Pfus (MW) = 0.40 600 ITER 15 MA 400 200 0 10 11 12 13 14 15 Ip– ITER (MA) George Sips21st IAEA Fusion Energy Conference, Chengdu, China, 16-21 October 2006
Prediction of fusion performance in ITER ASDEX Upgrade Improved H-modes 1200 Most of the scaled edge pedestal temperatures are within range of what is expected for typical H-modes in ITER. 5.3keV ± 23% Open symbols Paux > 73 MW Closed symbols Paux≤ 73 MW 1000 800 Pfus (MW) 600 Sugihara M. et al 2003 Plasma Phys. Control. Fusion 45 L55 400 200 5.3 keV ± 23% 0 2 4 6 8 Te,ped_ITER (keV) George Sips21st IAEA Fusion Energy Conference, Chengdu, China, 16-21 October 2006