Download
1 / 5
50 likes | 151 Views

E N D
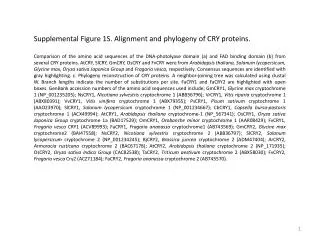
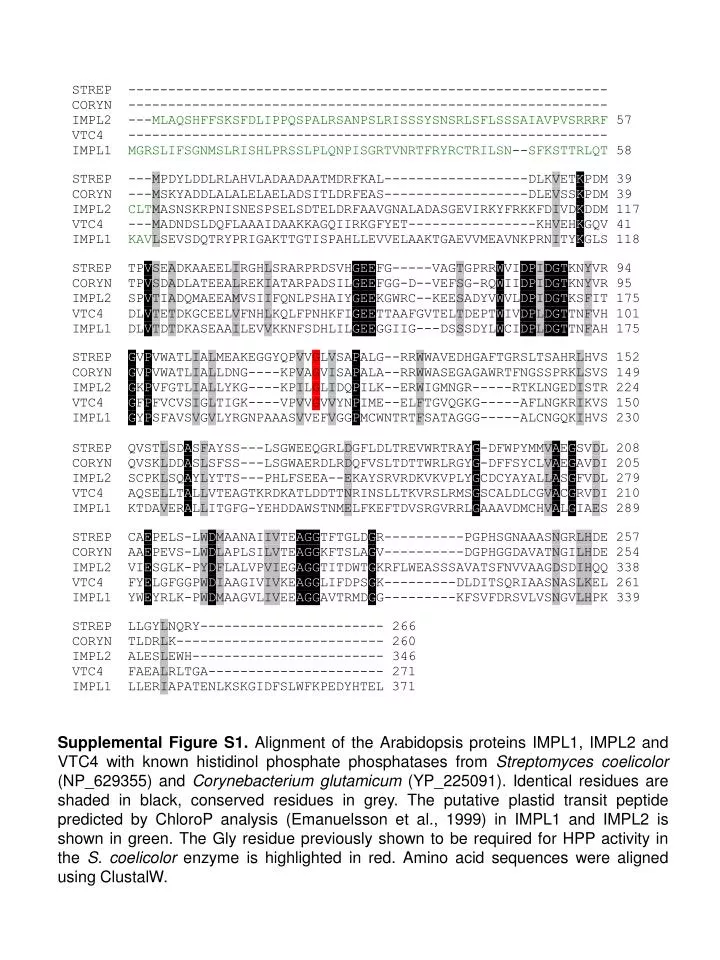
Supplemental Figure S1. Alignment of the Arabidopsis proteins IMPL1, IMPL2 and VTC4 with known histidinol phosphate phosphatases from Streptomycescoelicolor (NP_629355) and Corynebacteriumglutamicum (YP_225091). Identical residues are shaded in black, conserved residues in grey. The putative plastid transit peptide predicted by ChloroP analysis (Emanuelsson et al., 1999) in IMPL1 and IMPL2 is shown in green. The Gly residue previously shown to be required for HPP activity in the S. coelicolor enzyme is highlighted in red. Amino acid sequences were aligned using ClustalW.
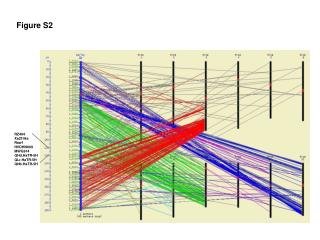
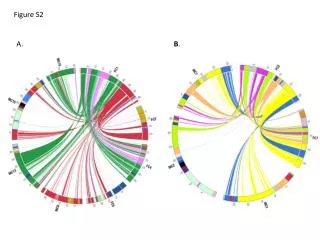
Supplemental Figure S2. pGenTHREADER alignment used to generate homology model of IMPL2.
A Mean signal intensity (± SE) Mean signal intensity (± SE) B
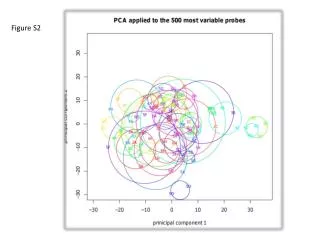
C Mean signal intensity (± SE) Supplemental Figure S3. Expression patterns of VTC4, IMPL1 and VTC4 in Arabidopsis.(A) IMPL2 expression in tissue types, (B) IMPL2 expression at different developmental stages and (C) IMPL1, IMPL2 and VTC4 expression in pollen, ovary, embryo and imbibed seed. Values shown are mean signal intensities ± SE, and were obtained from analysis of publically available microarray datasets using Genevestigator V3.
Supplementary Table SI. Top 10 genes showing the strongest positive correlation with IMPL2 expression across 322 publically available microarray datasets. The list was generated using the Arabidopsis Coexpression Data Mining tool. Genes highlighted in grey are known to encode enzymes of the His biosynthetic pathway.