Download
1 / 44
500 likes | 714 Views
On Estimation of Surface Soil Moisture from SAR. Jiancheng Shi Institute for Computational Earth System Science University of California, Santa Barbara. Today’s Outline. Image base algorithms for estimation of soil moisture Problems – roughness and vegetation

E N D
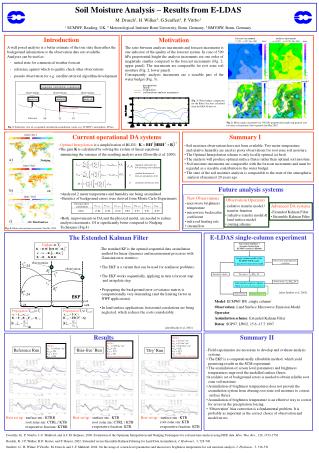
On Estimation of Surface Soil Moisture from SAR Jiancheng Shi Institute for Computational Earth System Science University of California, Santa Barbara
Today’s Outline Image base algorithms for estimation of soil moisture • Problems – roughness and vegetation • Current available SARs – Single frequency and polarization • Concept and problem with current available SAR • Multi-polarization SARs • Current available algorithms • Algorithm Development • On Improvement of bare surface inversion model • On estimation of vegetated surface soil moisture with repeat-pass polarimetric measurements
Current Concept on Using Repeat-pass Measurements • Basic Concept • • • • Two measurements => the relative change in dielectric properties • The absolute dielectric properties <= one measurement is known
Problem of Repeat-pass Measurements • Problems: • •Large dynamic range ks & kl • => a different response of • dielectric properties • Roughness effects can not be eliminated • Effectis greater • VV than HH • large incidence than small incidence Normalized Polarization functions - R/min(R) 23° SP-VV SP-HH GO Relative moisture change in %
Current Techniques Using Polarization Measurements • Basic understanding on HH and VV difference: • As dielectric constant , the difference • As roughness (especially rms height) , the difference • As incidence angle , the difference • Common idea of the current algorithms • • • • Inverse - two equations two unknowns.
Current Algorithms for Bare Surface (1) • Oh et al., 1992. • Semi-empirical model ground scatterometer measurements • Using 3 polarizations 2 measurements
Current Algorithms for Bare Surface (2) Dubios et al., 1995 • Semi-empirical model ground scatterometer measurements • Using 2 co-polarizations 2 measurements
Current Algorithms for Bare Surface (3) • Shi et al., 1997. • Semi-empirical model IEM simulated most possible conditions • Using 2 combined co-polarizations 2 measurements
Numerical Simulations by Multi-scattering IEM • one 500 MHz alpha Workstation - more than 200 CPU hours for one incidence • T3E supercomputer at GSFC/NASA - less than 3 CPU hours (160 processors)
Normalized Backscattering Coefficients (HH*VV)^0.5 (HH*VV)^0.5 HH+VV HH+VV
Current Algorithms for Bare Surface (3) • Shi et al., 1997. • Semi-empirical model IEM simulated most possible conditions • Using 2 combined co-polarizations 2 measurements
Sensitivity of Inverse Model to Calibration 30°, 40°, 50° Absolute Error:± Error in both HH & VV Relative Error:+ Error in one & - error in the other
Experimental Description JPL L-band AIRSAR (June 10 – 18, 1992) VV, VH, HH 10 12 13 10 14 16 18
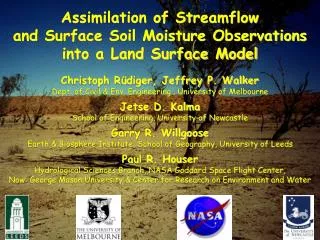
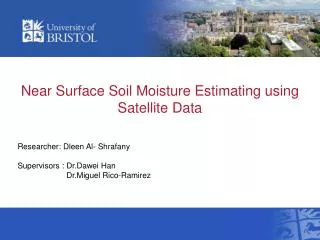
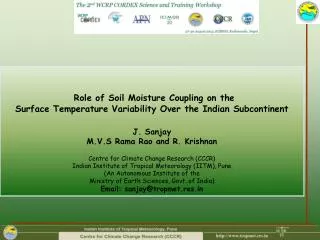
Estimated Soil Moisture Maps by SIR-C’s L-band Image in April, 1994
Estimated Surface RMS Height Maps by SIR-C’s L-band Image in April, 1994
Comparing Field Measurements Standard Error (RMSE) 3.4% in Soil Moisture estimation Standard Error (RMSE) 1.9 dB in roughness estimation
Basic Consideration (1) Common idea of the current algorithm • • Inverse - two equations two unknowns. It can be re-ranged to one equation for one unknown. Disadvantages: • Requires both formula all in good accuracy • Error in the estimated one unknown the other
Basic Consideration (1) - continue (a) ks (b) Sr (c) Rh in (a) in (b) in (c) • Different weight sensitive to different surface parameter • Independent direct estimation of soil moisture and RMS height
Basic Consideration (2) IEM -- Power expansion and nonlinear relationships Higher order inverse formula improve accuracy Example: estimate surface RMS height s’ s’ s s
Basic Consideration (3) Tradition Backscattering Models • Inverse model for different roughness region improve accuracy
Estimation of Surface RMS Height Inverse model Accuracy with the model simulated data RMSE in cm Incidence in 0
Sensitivity Test on Estimation of RMS Height • Absolute Error : to both VV and HH • Relative Error : to one; and to the other • Requires good calibration especially at small incidence -0.3 n/2 0.3 relative error in dB RMSE in cm 300 relative error = 0.5 dB absolute error = 2dB model accuracy Incident angle absolute error in dB
Estimation of Dielectric Constant Two Hypothesis Test: 1) without separation of roughness regions 2) with separation of roughness regions 0.5 1.0 1.5 2.0 2.5 3.0 3.5 Rh Normalized average indicator =
Sensitivity Test on Estimation of Dielectric ConstantNormalized average indictor Solid line with roughness separation Dotted line without roughness separation Solid line: model Dotted line: under absolute error 1 dB Dashed line: under relative 0.3 dB • The algorithm with separation of roughness region requires very accurate calibration
Validation Using Michigan's Scatterometer Data Correlation: mv - 0.75, rms height - 0.96 RMSE: mv - 4.1%, rms height - 0.34cm mv S RMSE for S Estimated incidence Measured parameters
Limitations of Using Polarization Measurements A L-Band (A) - % of the simulated ratio > 1.0 dB (B) - % of the simulated vh > -27 dB at C-band (C) - ratio in dB at L-band at 30° (D) - at 50°. % C-Band C-Band B % Incidence angle C 50° Both with s=1.0 cm & cl=7.5 cm 30° D Moisture in % Moisture in %
Summary on Using Polarization Measurements Advantages of L-band VV and HH measurements Larger dynamic range - directly estimate soil dielectric & RMS height Less sensitive to vegetation effects Problems: HH and VV has a little dynamic range at small incidence Effect of the system noise on vh measurements HH and VV difference - saturation at high incidence & moisture C-band polarization measurements has much less advantages than L-band
Characteristics of Backscattering Model First-order backscattering model (4) Fraction of vegetation cover Direct volume backscattering (1) Direct surface backscattering (4 & 3) Surface & volume interaction (2) Double pass extinction • Vegetation parameters – dielectric properties, scatter number densities, shapes, size, size distribution, & orientation • Surface parameters– surface dielectric and roughness properties
Radar Target Decomposition Covariance (or correlation) matrix Decomposition based on eigenvalues and eigenvectors where, are the eigenvalues of the covariance matrix, k are the eigenvectors, and k’ means the adjoint (complex conjugate transposed ) of k.
Radar Target Decomposition Technique Correlation or covariance matrix -> Eigen values & vectors VV, HH, VH Total Power: single, double, multi VV: single, double, multi HH
Relationships in scattering components between decomposition and backscattering model • First component in decomposition (single scattering) – direct volume, surface & its passes vegetation • Second component (double-bounce scattering) – Surface & volume interaction terms • Third component – defuse or multi-scattering terms
Properties of Double Scattering Component in Time Series Measurements • In backscattering Model • Variation in Time Scale • surface roughness • vegetation growth • surface soil moisture • Ratio of two measurements • independent of vegetation properties • depends only on the reflectivity ratio
Comparison with Field Measurements Two Corn Fields Dielectric Constant VV, HH, VH Date Normalized VV & HH cross product of double scattering components for any n < m Correlation=0.93, RMSE=0.42 dB Corresponding reflectivity ratio
Summary • Time seriesmeasurements with second decomposed components(double reflection)provide a direct and simple technique to estimate soil moisture for vegetated surface • Advantages of this technique is • Do not require any information on vegetation • Can be applied to partially covered vegetation surface
Discussion • Current understanding • Repeat-pass techniquestill requires surface roughness information. C-band is less sensitive to roughness than L-band. • Polarization technique L-band is better than C-band • Repeat-pass + polarimetric technique high potential on estimating vegetated surface soil moisture. L-band is better than C-band
Today’s Outline Image base algorithms for estimation of soil moisture • Problems – roughness and vegetation • Current available SARs – Single frequency and polarization • Concept and problem with current available SAR • Multi-polarization SARs • Current available algorithms • Algorithm Development • On Improvement of bare surface inversion model • On estimation of vegetated surface soil moisture with repeat-pass polarimetric measurements