Download
1 / 17
170 likes | 179 Views
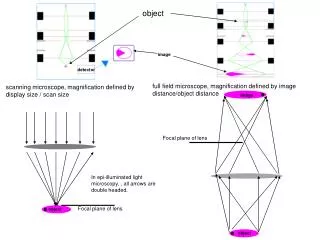
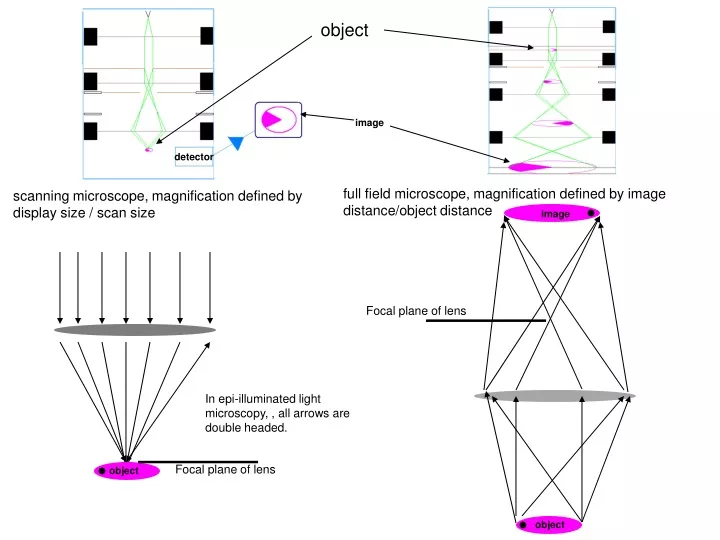
object. image. detector. full field microscope, magnification defined by image distance/object distance. scanning microscope, magnification defined by display size / scan size. image. Focal plane of lens. In epi-illuminated light microscopy, , all arrows are double headed.

E N D
object image detector full field microscope, magnification defined by image distance/object distance scanning microscope, magnification defined by display size / scan size image Focal plane of lens In epi-illuminated light microscopy, , all arrows are double headed. Focal plane of lens object object
laser in, signal from sample out In conventional microscopy the image point intensities of tiny objects are defined primarily by the collection pathway, in CSLM the illumination and detection pathways are equally important to defining this spot that is imaged. Both pathways travel through the objective lens and the confocal scanhead. Probe formation and signal collection in light microscopy (case study using Marshall U. MRC 1024 CSLM) X Y Z not shown (height is intensity) sample
Where do the excitation and emission filters go? Where is the confocal iris?
Illumination and detection path in MRC1024 confocal PMT detector optical filters (Neutral Density and excitation λ) gas, KrAr laser confocal iris optical fiber to carry laser to scanhead emission λ filter dichroic mirror (beam splitter) split excitation from emission ) dichroic mirror scan mirrors (galvo driven x & y) scan mirrors objective lens objective lens sample sample EM EX
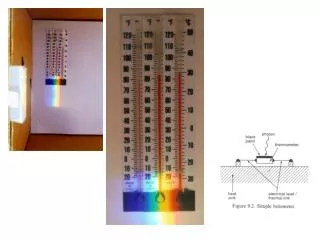
Different light sources have different spectra 488nm 568nm 647nm This is just one of the Hg lines at much higher spectral resolution. Low pressure gasses emit discreet lines of color as in this low pressure Hg spectrum (grey) overlaid with 3 of the major lines from a KrAr mixed gas laser, also low pressure (color).
gas gas black body gas Metal halide are very similar to gas arc but include metal iodides and bromides in the gas mix. Longer life and tunable spectrum (based on the metal used). black body All adapted from Murphy 2001 High pressure gasses in arc lamps emit relatively broad spectrum light (many more vibrational energy states than low pressure). Black body radiation as emitted from the tungsten filament in halogen/tungsten or standard tungsten filament sources varies with filament temperature and are UV and blue poor as well as being inefficient (heat).
Neutral Density Filtering (all λ are affected equally) Beer / Lambert relationship Transmittance: T = P / P0% Transmittance: %T = 100 T A=-log T A = log10P0/ PA = log10 1 / %T P0 Absorbance (OD): P A = ε(pathlength) concentration εdepends on the filter material, pathlength is thickness of filter, concentration is the conc. of material with ε in the filter Lets say this filter blocks 70% of the incident light so its T=.30 So, this filter has an A=.125 What happens if we double the width of the filter? T= ? A=? What is the A if the filter blocks out 99.7% of the incident light?
Short and long pass filtering with colored (colloidal) glass filters; these do not affect all wavelengths equally Absorbance <515nm A<515=-log T<515 515 LP or OG 515
Filtering with interference filters (most but not all band pass filters are interference filters) All of our confocal band pass filters and dichroic mirrors are interference filters, see website below or Slayter & Slayter 4.3. Also see the optical thin film example on course website. These filters are given absorbance and OD values but they DO NOT follow the Beer Lambert relationship with thickness and concentration. http://hyperphysics.phy-astr.gsu.edu/hbase/hph.html
Detector Signal in Signal out DM sample on microscope Laser Emission light (pink color) follows the same path as the excitation light (red) until we reach the dichroic mirror (DM). This DM prevents reflected laser signal from causing decreased contrast of our fluorescence signal. Purdue Univ.
Many lens elements with complex shapes are needed to bend and fold the light so that rays of different colors and those closer or further from the optical axis are focused to the same place. When the objective lens is perfectly designed and built, only then do we achieve ‘diffraction limited resolution’ as defined by the next slide. These objective lenses are corrected for chromatic and spherical aberrations and curvature of field. Apochromats are corrected at more wavelengths (colors) than achromats. Murphy 2001
Gaussian image points vs. Abbe’s theory of image formation; Gaussian ray tracing brings rays to an infinitely small and unacheivable point in space (what is dmin). Abbe’s theory of image formation states that a small interference pattern is formed by the perfect lens, this is the diffraction limited resolution. If you can develop technology that elegantly overcomes this barrier, you could win the Nobel prize. dmin = 1.22(λ) / NAcond + NAobj dmin = 1.22(λ) / 2 sin α η dmin = .61(λ) / NAobj (for epi- microscopy)NA (numericalaperture) = sin α η Gaussian theory works well for image formation of features larger than the dmin. Abbe’s theory works for describing features that are approximately the size of dmin or ~ the wavelength of light (or electrons) used.
What does the confocal iris or pinhole do? Airy pattern with central disk. Iris and diaphragm This is a 2D view of a 3D phenomenon. An interference pattern like this is projected at the PMT for each object/ image point as the beam scans the sample. The confocal iris or pinhole selects only part of this Airy pattern to reach the PMT, this can improve resolution. Its effect on the z-axis diffraction pattern (not shown) is even more dramatic. This is why with confocal we can take optical z-sections. Murphy 2001
Y X Z From Pawley, 1995
Yes, these are secondary e- like in SEM. Total voltage drop in a PMT may equal thousands of volts. Photocathode, usually coated, must be sensitive to Einstein’s photoelectric effect. (+++++) (++++) This PMT detector gives no spatial information on its own, only gives counts.The eye does give spatial information directly. It has an array of detectors (neurons). A ccd or film camera also directly record spatial information. (+++) (++) (+) (-) (- -) (- - -) emission filter Eye is most sensitive to green light, PMTs can have photocathodes made of materials sensitive to specific colors (Murphy spectra p.25 ) Adapted from university of British Columbia Physics http://www.olympusmicro.com/primer/flash/photomultiplier/index.html
Now lets include system noise into the detector. Lets assume that we get the equivalent of 1 photon/second of noise due to a light leak (this could also be electronic noise). Lets also assume that we get 16 photons/sec in real signal. Our PMT converts each photon into 10 electronic counts (gain of 10). Given the above information, what is the signal to noise (S/N) ratio (in electronic counts) per pixel in two cases; 1-scan rate= 1 pixel/second 2- scan rate = 1 pixel/10seconds? This can also be called signal/background ratio. One step further, all detector systems have some inherent ability to detect differences in intensity. It is not the signal /noise ratio that is important here, it is the absolute difference in signal intensity between 2 sample points. Try this with this 4x4 pixel, 8 bit image. Which pairs of pixels can be differentiated from each other? Each pixel pair has the same signal / signal ratio but the absolute differences vary. (+++++) (++++) (+++) 1 2 (++) 8 4 10 20 (+) 40 80 (-) (- -) (- - -) emission filter fast (? sec/scan) slow (4 sec/scan) Slowest (? sec/scan) Adapted from university of British Columbia Physics When sampling with more pixels, adjust scan rate to increase photons/pixel; this is a good idea unless you are worried about beam damage! The top row of 3 scans (not in box) was done at constant scan rate (what is the scan rate for the top row?) The photon flux from the sample in all cases is 16 photons/second.