Download
1 / 48
480 likes | 590 Views
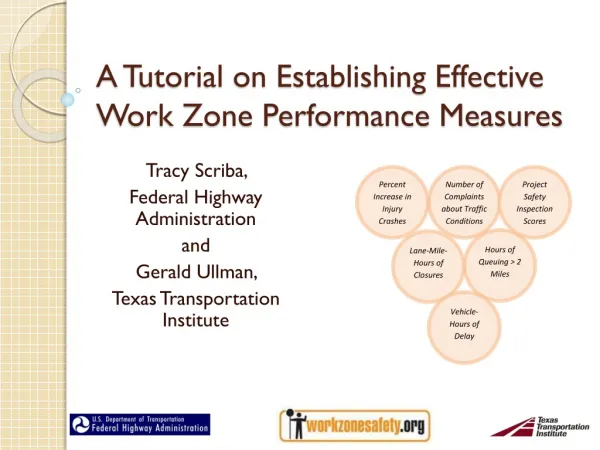
A Tutorial on Establishing Effective Work Zone Performance Measures. Tracy Scriba , Federal Highway Administration and Gerald Ullman, Texas Transportation Institute. What is Work Zone Performance Measurement?.

E N D
A Tutorial on Establishing Effective Work Zone Performance Measures Tracy Scriba, Federal Highway Administration and Gerald Ullman, Texas Transportation Institute
What is Work Zone Performance Measurement? • Determining progress or level of attainment towards specific defined agency objectives regarding: • Safety • Mobility • Customer satisfaction • Agency/contractor efficiency and quality • Evidence based
Why are Work Zone Performance Measures Important and Useful? • Quantifies work zone impacts • Effects on motorists • Actions taken to mitigate impacts • Effects of actions taken
Why are Work Zone Performance Measures Important and Useful? • Guides investment decisions, policy development, and program priorities • Identify trends • Refine policies and procedures • Emphasize accountability
Why are Work Zone Performance Measures Important and Useful? • Assists in communication and outreach • Aids agencies in “telling their story” • Facilitates better public understanding and acceptance • Ensures that elected officials have correct information
WZ Rule: WZ Data and PMs • Rule Goal: Better understand and manage WZ impacts • Related Provisions: • Impacts Assessment • Use of Data • Process Reviews • Move practice forward
WZ Rule Data Provisions • Requires agencies to use WZ data at both the projectand process-levels to manage and improve work zone safety and mobility • Project level: Improvements while projects are underway • Process level: Broad improvements over time • Recommends that agencies maintain data and information resources to support the use of WZ data for the above activities
Work Zone Performance Nationally: Work Zone Self Assessment • Done annually since 2003 • 10.3 average (0 to 15 scale)
Challenges in Measuring Work Zone Performance • Defining objectives that are: • Acceptable • Realistic • Useful • Identifying and obtaining useful data • Allocating sufficient resources (staff and money)
Work Zone Performance Measurement Myths • “Measurements must be obtained for all work zones” • Reality: It may be only necessary to monitor a set of key work zones • “Measurements must be continuous at the work zones that are monitored” • Reality: It may only be necessary to obtain a few key measurements during the right times and at the right locations in a work zone
Work Zone Performance Measurement Myths • “A lot of time and money must be spent on data collection” • Reality: Depending on project characteristics, low-cost data collection methods may be available and appropriate
Work Zone Performance Measurement Myths • “A lot of time and money must be spent on data collection” • Reality: depending on project characteristics and agency goals, low-cost data collection methods may be available and appropriate Work zone performance measurement is simply a tool that can help an agency accomplish its mission more effectively
Making Work Zone Performance Measurement Happen in your Agency
Key Steps • Identify and engage stakeholders • Select appropriate measures • Identify available data sources • Define analysis requirements • Assign roles and responsibilities • Define methods for disseminating results • Periodically review and refine measures
1. Identify and Engage Stakeholders to Define: • Needs for performance measures • Performance goals or targets (based on policy and procedures) • Performance measurement “champions”
2. Select the Measures • Base on the performance goals or targets identified • Keep to a manageable number • Consider data needs • Start simple, refine and expand as needs and uses dictate
Measures to consider • Exposure • Vehicle exposure • Work activity exposure • Safety • Crashes or accidents • Safety surrogates • Mobility • Queues • Travel times or delays • Travel time reliability • Agency ratings • Customer complaints or ratings
3. Identify Data Needs and Sources • Exposure data • Project plans • Agency construction management database • Inspector diaries • Lane closure request databases • Automatic traffic recorder (ATR) counts • Planning division AADT estimates • Manual counts • Real-time electronic traffic surveillance data • Safety data • Statewide crash database • Agency collected work zone crash data • Occupational safety records • Agency field reviews • Service patrol or EMS dispatch logs
3. Identify Data Sources (cont’d) • Mobility data • Electronic traffic surveillance technologies • Observations and documentation of queues by field personnel or transportation management center operations staff • Travel time runs by staff or interns • Agency inspection scores • Customer survey responses • Customer complaint files
Electronic Traffic Surveillance Sources • Point measurements of speed, volume • Existing transportation management system spot sensors • Work zone ITS deployments • Portable traffic monitoring devices • Point-to-point travel times • Automatic vehicle location, identification systems • License-plate recognition systems • Cellular telephone signal tracking • Bluetooth • Purchase of private-sector data
4. Define Analysis Requirements • Estimating travel times and delays from queue length documentation • Estimating queue lengths from spot sensor data
Travel Times from Queue Lengths • Notes: • Appropriate only if pre-work zone conditions do not experience queues • Other speed/density/flow relationships could be assumed
Queues from Spot Speed Sensors • Steps: • Divide roadway into segments of uniform speed • Examine speeds and volumes hour-by-hour • Compare speeds across sensors • Sum regions where speeds are below thresholds • Compute individual and vehicle-hours of delay
5. Assign Roles and Responsibilities • Data collection • Analysis • Decision-making • Dissemination
6. Define Methods for Disseminating Results • Consider key users • Technical managers and decision makers • Public and political leaders • Tailor messages to each user group as appropriate
7. Review and Refine Measures • Key questions: • Do measures aid in evaluating progress? • Do measures point to changes that may be needed in policies or procedures?
One Example… • An agency currently reviews its total fatal work zone crashes each year
The Agency Selects a Measure: • Change in severe (injury + fatal) crash rates from pre-work zone conditions • Initial focus will be on freeway work zones • Each of 4 districts to evaluate two of its work zones annually
Results • Observations made by the agency • Rates do trend higher • Increases are highly variable • Agency performs detailed analysis of projects • Project durations and volumes vary widely • Identifies some good practices, issues to address
They also modify their analysis methodology… Crash Analysis Results the Following Year aExpected crashes computed using Highway Safety Manual approach
Another Example… • An agency has adopted a policy that no work zones will create more than a 15-minute delay for motorists • 9 complaints per month from motorists • Are delays occurring, and are they greater than 15 minutes? • Institute procedures for inspectors to document all queues that occur and estimate delays
Observations • Impacts being observed at a small (< 10 %) number of projects • Unclear how many motorists are being excessively delayed • Adjust monitoring to determine % of vehicles experiencing greater than 15 minutes of delay
Recomputed Results … • Next steps taken: • Interns are hired to assist in traffic monitoring (requested by project engineers) • Requirement to document queues is extended to the maintenance section • Percent of projects that exceed agency delay threshold is added to dashboard metrics on agency website
A Final Example • The director of an agency assigns the traffic operations division to establish a work zone performance measurement program…
1. Identify and Engage Stakeholders • Key agency staff • Division staff • District engineers • Public information office • Project design division • Performance targets • Vehicle delays < 15 min • 85% of users who encounter a delay warned in advance • Crashes no more than 20% greater than expected without a work zone present
2. Select Appropriate Measures • Individual vehicle delays during hours of delay • Percent of customers indicating awareness of when and where delays were going to occur • Ratio of actual severe crashes to expected crashes
3. Identify Data Sources • Project designers: • identify any projects with peak-hour volume-to-capacity > than 0.9 • Interns: • conduct peak-hour travel time studies at projects after each phase change • Inspectors: • document queues during any short-term lane closures in Districts
3. Identify Data Sources (cont’d) • University: • conduct annual survey of customer opinions about work zones • Statewide crash database to be used to evaluate 5 high-volume projects annually
4. Define Analysis Requirements • Interns to gather and analyze project inspector data on queues monthly • Interns compute delays based on queue data • Safety division to provide expected crash frequencies at selected project locations (based on Highway Safety Manual procedures) • University – customer survey analysis
5. Assign Roles and Responsibilities • Division staff • Hiring and supervising interns • Coordinating information collection and analysis on key projects • Assessing implications of measures on agency policies and operations • District engineers • Issue requirement regarding project inspector documentation of queues
5. Roles and Responsibilities (cont’d) • Project design division staff • Identify key projects • Safety division staff • Develop baseline crash frequencies • Public information office • Creation of summary document for director • Posting results on agency website (dashboard)
6. Define Methods for Disseminating Results • Executive summary document • Director, public officials • Dashboard summary on website • General public • Presentation of results at annual short course
7. Periodically Review and Refine Measures • Revisit every two years as part of process assessment • Stakeholders to meet to discuss need to expand or contract effort, identify additional information needs or issues to be examined
Resources • A Primer on Work Zone Safety and Mobility Performance Measurement • Work Zone Performance Measures Pilot Test • Domestic Scan on Work Zone Assessment, Data Collection, and Performance Measurement Available at http://www.ops.fhwa.dot.gov/wz/decision_support/performance-development.htm
Questions? Tracy Scriba, FHWA (202) 366-0855 Tracy.Scriba@dot.gov Gerald Ullman, TTI (979) 845-9908 g-ullman@tamu.edu