Download
1 / 1
20 likes | 143 Views
Specific calibration and uncertainty evaluation for flood propagation models by using distributed information. 1 Research Institute for Geo-Hydrological Protection, National Research Council, Perugia ITALY 2 University of Messina, Department of Civil Engineering, Messina ITALY.

E N D
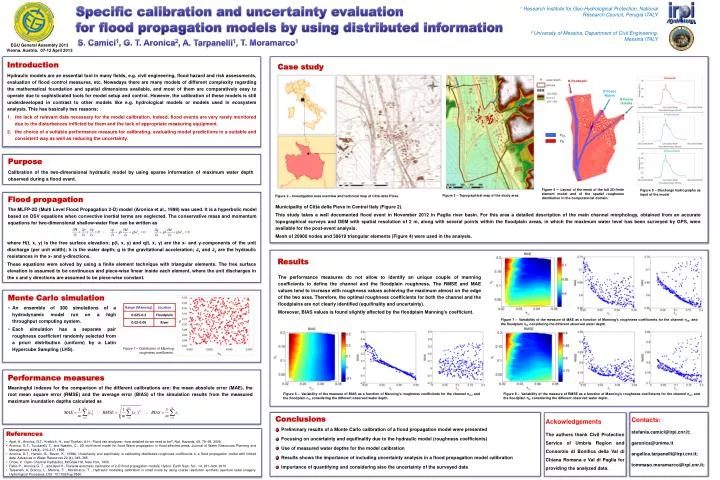
Specific calibration and uncertainty evaluation for flood propagation models by using distributed information 1 Research Institute for Geo-Hydrological Protection, National Research Council, Perugia ITALY 2 University of Messina, Department of Civil Engineering, Messina ITALY S. Camici1, G. T. Aronica2, A. Tarpanelli1, T. Moramarco1 EGU General Assembly 2013 Vienna, Austria, 07-12 April 2013 Introduction Hydraulic models are an essential tool in many fields, e.g. civil engineering, flood hazard and risk assessments, evaluation of flood control measures, etc. Nowadays there are many models of different complexity regarding the mathematical foundation and spatial dimensions available, and most of them are comparatively easy to operate due to sophisticated tools for model setup and control. However, the calibration of these models is still underdeveloped in contrast to other models like e.g. hydrological models or models used in ecosystem analysis. This has basically two reasons: the lack of relevant data necessary for the model calibration. Indeed, flood events are very rarely monitored due to the disturbances inflicted by them and the lack of appropriate measuring equipment. the choice of a suitable performance measure for calibrating, evaluating model predictions in a suitable and consistent way as well as reducing the uncertainty. Case study Q Ponticelli Q Fosso Nuovo Q Fosso Osteria nch nfl Purpose Calibration of the two-dimensional hydraulic model by using sparse information of maximum water depth observed during a flood event. Figure 4 –Layout of the mesh of the full 2D-finite element model and of the spatial roughness distribution in the computational domain. Figure 5 – Discharge hydrographs as input of the model Figure 3 – Topographical map of the study area. Floodpropagation The MLFP-2D (Multi Level Flood Propagation 2-D) model (Aronica et al., 1998) was used. It is a hyperbolic model based on DSV equations when convective inertial terms are neglected. The conservative mass and momentum equations for two-dimensional shallow-water flow can be written as Figure 2 – Investigation area overview and technical map of CittàdellaPieve. Municipality of CittàdellaPieve in Central Italy (Figure 2). This study takes a well documented flood event in November 2012 in Paglia river basin. For this area a detailed description of the main channel morphology, obtained from an accurate topographical surveys and DEM with spatial resolution of 2 m, along with several points within the floodplain areas, in which the maximum water level has been surveyed by GPS, were available for the post-event analysis. Mesh of 20900 nodes and 39619 triangular elements (Figure 4) were used in the analysis. where H(t, x, y) is the free surface elevation; p(t, x, y) and q(t, x, y) are the x- and y-components of the unit discharge (per unit width); h is the water depth; g is the gravitational acceleration;Jx and Jy are the hydraulic resistances in the x- and y-directions. These equations were solved by using a finite element technique with triangular elements. The free surface elevation is assumed to be continuous and piece-wise linear inside each element, where the unit discharges in the x and y directions are assumed to be piece-wise constant. Results The performance measures do not allow to identify an unique couple of manning coefficients to define the channel and the floodplain roughness. The RMSE and MAE values tend to increase with roughness values achieving the maximum almost on the edge of the two axes. Therefore, the optimal roughness coefficients for both the channel and the floodplains are not clearly identified (equifinality and uncertainty). Moreover, BIAS values is found slightly affected by the floodplain Manning’s coefficient. • Monte Carlo simulation • An ensemble of 300 simulations of a hydrodynamic model run on a high throughput computing system. • Each simulation has a separate pair roughness coefficient randomly selected from a priori distribution (uniform) by a Latin Hypercube Sampling (LHS). Figure 7 –Variability of the measure of MAE as a function of Manning’s roughness coefficients for the channel nch, and the floodplain nfl, considering the different observed water depth. Figure 1 – Distribution of Manning roughness coefficients. Performance measures Meaningful indexes for the comparison of the different calibrations are: the mean absolute error (MAE), the root mean square error (RMSE) and the average error (BIAS) of the simulation results from the measured maximum inundation depths calculated as Figure 6 –Variability of the measure of BIAS as a function of Manning’s roughness coefficients for the channel nch, and the floodplain nfl, considering the different observed water depth. Figure 8 –Variability of the measure of RMSE as a function of Manning’s roughness coefficients for the channel nch, and the floodplain nfl, considering the different observed water depth. Contacts: stefania.camici@irpi.cnr.it; garonica@unime.it angelica.tarpanelli@irpi.cnr.it; tommaso.moramarco@irpi.cnr.it; Ackowledgements The authors thank Civil Protection Service of Umbria Region and Consorzio di Bonificadella Val di ChianaRomana e Val di Paglia for providing the analyzed data. • Conclusions • Preliminary results of a Monte Carlo calibration of a flood propagation model were presented • Focusing on uncertainty and equifinality due to the hydraulic model (roughness coefficients) • Use of measured water depths for the model calibration • Results shows the importance of including uncertainty analysis in a flood propagation model calibration • Importance of quantifying and considering also the uncertainty of the surveyed data • References • Apel, H., Aronica, G.T., Kreibich, H., and Thieken, A.H.: Flood risk analyses—how detailed do we need to be?, Nat. Hazards, 49, 79–98, 2009. • Aronica, G.T., Tucciarelli, T., and Nasello, C.: 2D multi-level model for flood Wave propagation in flood-affected areas, Journal of Water Resources Planning and Management, 124(4), 210-217, 1998. • Aronica, G.T., Hankin, B., Beven, K., 1998b. Uncertainty and equifinality in calibrating distributed roughness coefficients in a flood propagation model with limited data. Advances in Water Resources 22 (4), 349–365. • Chow, V.: Open Channel Hydraulics, McGraw-Hill, New York, 1959. • Fabio P. , Aronica G. T. , and Apel H., Towards automatic calibration of 2-D flood propagation models, Hydrol. Earth Syst. Sci., 14, 911–924, 2010 • Tarpanelli, A, Brocca, L., Melone, F. , Moramarco, T. , Hydraulic modelling calibration in small rivers by using coarse resolution synthetic aperture radar imagery. Hydrological Processes, DOI: 10.1002/hyp.9550