Download
1 / 20
200 likes | 307 Views
A Case Study of Severe Winter Convection in the Midwest. Paul Cody and Tim Gibbs. Lecture Outline. Introduction Background Synoptic Analysis Mesoscale Analysis Lincoln and Davenport Sounding Analyses Radar Analysis Lightning Analysis Summary. Introduction .

E N D
A Case Study of Severe Winter Convection in the Midwest Paul Cody and Tim Gibbs
Lecture Outline • Introduction • Background • Synoptic Analysis • Mesoscale Analysis • Lincoln and Davenport Sounding Analyses • Radar Analysis • Lightning Analysis • Summary
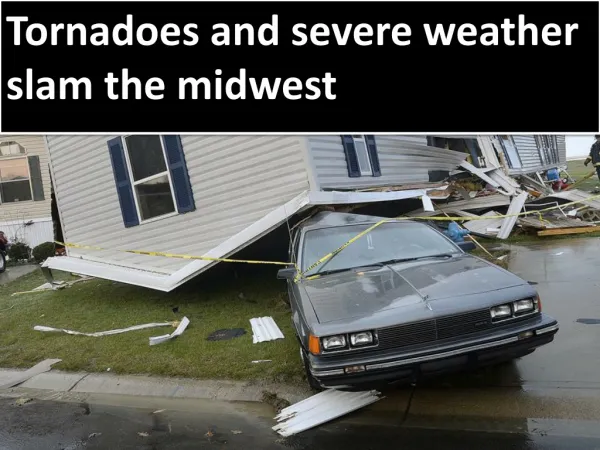
Introduction • On the evening of February 11th 2003, a line of severe thunderstorms moved through Southeast Iowa and Northwest and Central Illinois. • Winds exceeded 50 kts (27 and a brief period of heavy snowfall created whiteout conditions. • The NWS in Lincoln, Illinois issued a severe thunderstorm warning for several counties due to strong winds and heavy snowfall.
Introduction • The first severe thunderstorm warning was issued at 0002 UTC on February 12th for Marshall County, Illinois. • Within the hour, the front had passed, leaving wind damage (gusts exceeding 50 knots), downed power lines, and utility poles, as well as a unique feature called snowrollers that formed in Peoria, Illinois (PIA). http://www.crh.noaa.gov/ilx/events/roller/roller.php
Introduction • This case is unique as it did not fall into a specific operational paradigm. • How do we choose a forecast warning that bests communicates the nature of the hazard? • Severe Thunderstorm Warning(SVR) • .75” diameter hail and wind gusts >58 mph • High Wind Warning (HWW) • Surface wind gusts of >58 mph due to synoptic scale pressure gradients, terrain-forced winds or mesoscale winds associated with a wake low behind a squall line.
Background • This event was uncommon for thundersnow cases since it was not a case of elevated convection due to the presence of an extratropical cyclone. • This event had maintained qualities related to warm season/sector weather rooted in the Planetary boundary layer, like squall lines. • A warm season event that occurred in the cold season.
Synoptic Analysis • Cold front was found on surface analysis at 1500 UTC over South Dakota, progressing to southeast Northern Missouri by 0000 UTC. • During morning hours, majority of the precipitation was upstream of the cold front • Transitioned to prefrontal during afternoon and at time of thundersnow event • Significant pressure gradient ahead of the cold front in the warm sector and in the cold air behind it • Cold front conditions: • 1) Intense 33 min snowshower • 2) Skies cleared post shower and dewpoints fell • 3)Moderate veer in <1 hr tempered by blustery post frontal conditions • Huron, SD has severe wind criteria, but lacked precipitation or lightning
Synoptic Analysis • A 300-hPa polar jet was present stretching from Central Canada to the Ohio valley • Winds exceeded 135 kts • Iowa and Illinois were near the core, but more towards the left entrance region: • Not typical for severe weather as it is a region of upper level convergence Figure: 300-hPa wind field. Jet streak in shaded region
Synoptic Analysis • Low-amplitude shortwave trough at 500-hPa stretched from Hudson bay through mid-west • Significant slope into cold air, consistent with a cold front • Circular absolute vorticity maximum in the base of the trough suggests quasi-geostrophic forcing on polarward side of 300-hPa jet Shaded region shows absolute vorticity shaded every
Synoptic Analysis • Q-Vector convergence occurred over central Illinois • Additional supporting evidence for midtropospheric ascent Figure: Q-vectors and Q-vector Divergence (700-400 hPa)
Mesoscale Analysis • Observed low level frontogenesis, vertical motion, and CAPE revealed an environment with necessary ingredients for convection. • Combination of substantially increasing frontogenesis and collocation of CAPE (albeit decreasing) and vertical motion produced whiteout conditions. • Analyses depict: • A dynamically forced region along and ahead of the surface cold front • Strong frontogenetic forcing made significant direct thermal mixing likely • Relatively deep dry-adiabatic layer (~100 hPa) along and just ahead of cold front provided little inhibition for parcels to be lifted to LCL • The lower troposphere as a region conducive to vertical motion.
Mesoscale Analysis • Values (Areas along cold front): • Frontogenesis • 5.0 – 10 @ 925 hPa • Vertical Motion • -20 ≤ ω ≤ -10 • CAPE • Exceeded 50
Lincoln, IL Sounding1200 UTCWell ahead of cold front & mostly cloudy conditionsLowest 100 hPa- Very cold temps.- Significant veering -Weakly sheared unidirectional flow above the boundary layer0000 UTC-Revealed a warmer, moister environment in lowest 200 hPa-CAPE of most unstable parcel lifted from 862 hPa – meager 3 J/kg, but atmospheric profile was nearly dry adiabatic (862 – 625 hPa) 1200 UTC: solid lines 0000 UTC: dashed lines
Davenport, IASounding1200 UTC:Also ahead of cold front, showed cold near-surface temps., and an unidirectional shear signature0000 UTC:-Also revealed significant 12-h warming in lowest 200 hPa and moistening in the lowest 100-hPa-One difference is the cooling and significant drying in mid-troposphere:encouraging development of potential instability-Launched as the precipitation band approached- Surface temps were changing rapidly as a result- Suggested a super-adiabatic surface layer 1200 UTC- Solid lines 0000 UTC- Dashed lines
Radar Analysis • REFLECTIVITY: • Maximum reflectivities: 40 - 45 dBZ • Storm tops never exceeded 3.7 km • Highest reflectivities limited to lower portions of strongest cells • Deviations from traditional severe weather producing squall lines (radar and velocity data): • No rear in-flow jet • No stratiform precipitation region • No front-to-rear flow • Did not evolve through usual stages of squall line evolution
Radar Analysis • Instead the was a convective line that more closely resembled a parallel stratiform convective system (MCS), however: • The area of stratiform precipitation on the left flank • No tendency for cell decay on left flank • No new cell generation on the right as should be expected • Severe winds were not the result of squall line convection but rather the mixing associated with the mesoscale and synoptic systems • Convective line tilted slightly down shear, which was likely due to a lack of CAPE ahead of the front and convective line and the strong ambient vertical wind shear
Lightning Analysis • Rare for winter event • Data clearly shows the temporal and spatial extent of thunderstorm activity • Convective line’s progression towards the southeast was depicted well using lightning data • Whereas most “winter” lightning is (+) in polarity, a majority of the strikes (97 of 101) were (-) in polarity • Taniguchi et al. (1982) and Brooke et al. (1982) hypotheses that shear in the cloud layer controls the polarity of a lightning strike were confirmed
Summary • RUC analysis supported the formation of convection along the cold front, through a dry adiabatic layer in the PBL • The thermodynamic profile was conducive to lightning production yet cold enough for snow • Large amount of negative lightning contrasts with prior studies • Severe thunderstorm warning was best response to conditions • Choice of SVR over HWW forecast: • Rapid movement of line • Rapid onset and decrease of severe winds • Area affected closer to a warm season squall line than either a high wind event due to synoptic-scale pressure gradient or mesoscale wake low event. • Main difference from warm season SVR (snow, blowing snow, could have easily been mentioned in warning text)