Download
1 / 16
160 likes | 168 Views
This paper explores the relationship between disability and retirement among aging baby boomers. It examines labor force participation rates, early retirement trends, and factors influencing retirement decisions. The study offers valuable insights into the challenges and opportunities of retirement for this generation.

E N D
Disability and Retirement Among Aging Baby Boomers By Ralph E. Smith Congressional Budget Office December 2005 This paper was prepared for presentation at the 18th Annual Policy Research Conference of the National Academy of Social Insurance, Washington, DC, January 20, 2006. The views expressed are those of the author and should not be interpreted as those of the Congressional Budget Office. 1
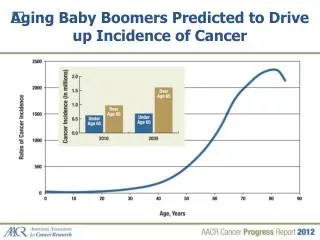
Figure 1. Labor Force Participation Rates of Men and Women, by Age, 2005 (Percentage of Population) 2 SOURCE: Estimates based on data from the Current Population Survey for the first ten months of 2005.
Figure 2a. Men Not in Labor Force, by Age, 2005 (Percentage of Population) 4 SOURCE: Estimates based on data from the Current Population Survey for the first ten months of 2005.
Figure 2b. Women Not in Labor Force, by Age, 2005 (Percentage of Population) 5 SOURCE: Estimates based on data from the Current Population Survey for the first ten months of 2005.
Figure 3a. Labor Force Participation Rates of Men Ages 55 to 64, 1948 to 2004 (Percent) 6 SOURCE: Estimates based on data from the Bureau of Labor Statistics.