Download
1 / 16
160 likes | 165 Views
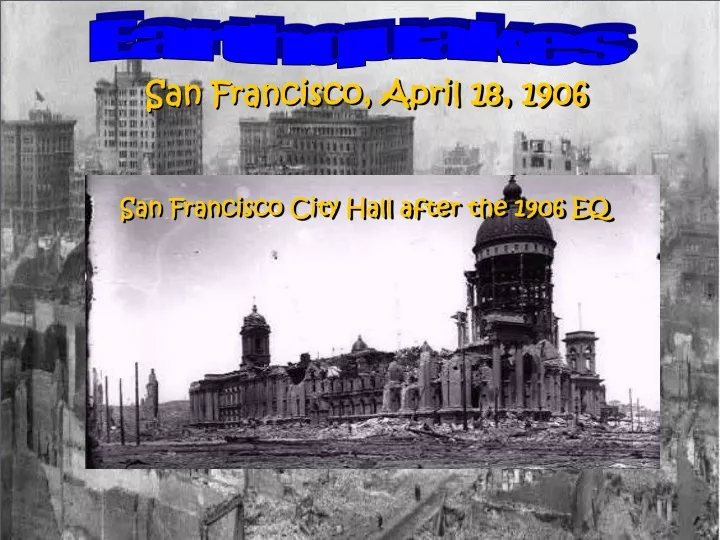
Earthquakes. San Francisco, April 18, 1906. San Francisco City Hall after the 1906 EQ. Objectives for this Lab: Understand how to interpret seismograms and record data Use seismic data and determine magnitude an earthquake Use seismic data to determine the location

E N D
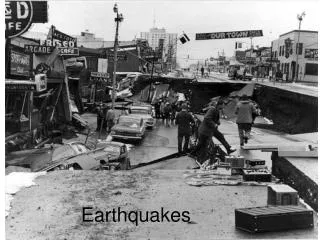
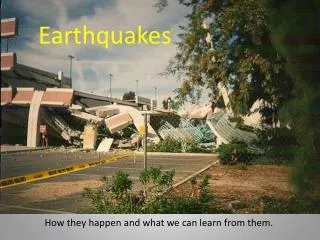
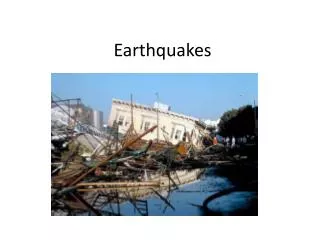
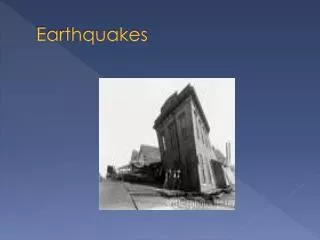
Earthquakes San Francisco, April 18, 1906 San Francisco City Hall after the 1906 EQ
Objectives for this Lab: • Understand how to interpret • seismograms and record data • Use seismic data and determine magnitude • an earthquake • Use seismic data to determine the location • of earthquake epicenters
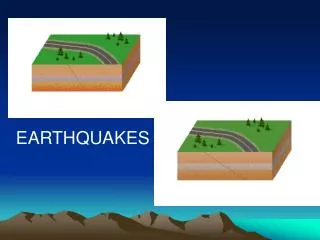
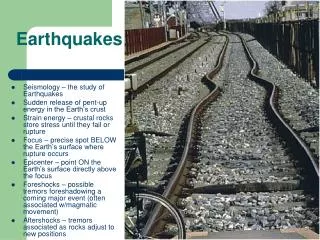
Consider a rock that is dropped in calm water. What happens? Earthquake – vibrations within the earth that produce rapid release of energy in the form of seismic waves
“Good Vibrations” – released seismic waves • Three major seismic waves are released: • The P-wave • The S-wave • The L-wave (surface wave) • What measures the incoming seismic waves? • The Seismograph The Seismograph The inertia of the suspended mass keeps the seismograph motionless while the seismic waves vibrate the recording drum anchored to the bedrock – produces a seismogram
P-wave (primary wave) • the fastest • compressional wave • moves through solids • and liquids • S-wave (secondary wave) • 2/3 speed of P-wave • shearing wave • moves through solids • only • Love wave (surface wave) • slowest waves • side-to-side (surface) • “We” feel these waves • Rayleigh wave (surface wave) • slowest wave • “rolling” wave • like floating on a boat • type motion
Did you feel the earthquake? – Measuring an EQ What’s the difference between an 8 magnitude and a 6.5 magnitude? Two ways to measure EQ’s: MercalliIntensity Scale Richter Scale
Modified Mercalli Intensity Scale • measures the intensity of the EQ – how much • damage occurs • closer to the epicenter-- more damage • farther from the epicenter -- less damage • people report the damage • destruction is assigned a Roman Numeral (I – XII) • I – least intensity • XII – greatest intensity Less intense More intense 23
Richter Scale (Charles Richter – 1935) • measures the intensity of an EQ using a seismogram • maximum intensity = largest amplitude recorded • EQ intensity is based on the logarithmic scale. • each step (M1…M2…M3..) increases the amplitude X10 • M5 has an amplitude 10 times larger than an M4 • M5 has an amplitude 100 times larger than an M3 • What about the energy released? • Each increase in Richter amplitude (by 10) increases energy 32 times so, • An M6 releases 32 more times energy than an M5. • An M6 releases _____ more times energy than an M4. • An M6 releases _____ more times energy than an M3. • An M6 releases ________ more times energy than an M2. largest amplitude 1,024 32,768 1,048,576 What observations can you make about the increasing energy release from one magnitude to the next?
Interpretation of a seismogram S-P time interval S-P interval (S-wave subtract P-wave) = in seconds The height of the wave (mm) P-wave S-wave Amplitude P-wave S-wave P-wave S-wave
Calculate the S-P interval: P-wave arrivalS-wave arrival S-P interval 21hr 32m 40sec 21hr 33m 10sec 15hr 23m 19sec 15hr 24m 5sec 3 hr 16m 32sec 3 hr 17m 13sec 19hr 43m 12sec 19hr 43m 52sec 20hr 58m 42sec 20hr 59m 16sec 30 sec 46 sec 41 sec 40 sec 34 sec
Calculating the Richter Magnitude S P 20 5 5 magnitude 220 km distance
Seismograph Stations S-P S-P B S-P A D S-P 8M C What is the magnitude at each station? How would the Mercalli scale relate to each station? SAF
Interpreting magnitude at various seismic stations More damage Although, there are different size triangles, the ratio of (2) remains the same. 40 2 24 A closest 32 B Analogy 20 12 2 16 Although, there are different S-P interval seismograms, the magnitude remains the same C 10 6 2 8 How does magnitude relate to the Mercalli scale?? 5 3 D 2 4 Less damage
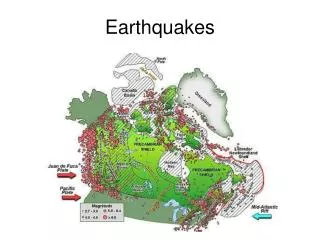
Triangulation – locating the epicenter of an EQ SS = seismic station D = distance to epicenter SS-A D D SS-C Epicenter SS-B D
Finding the epicenter using triangulation • intersection of three circles = epicenter location • the radius of circle = distance to epicenter from • a single earthquake • use the S-P interval vs. Distance chart to • find the distance to the epicenter from a single EQ S-P interval (min, sec) Distance (km, mi)