Download
1 / 10
100 likes | 110 Views
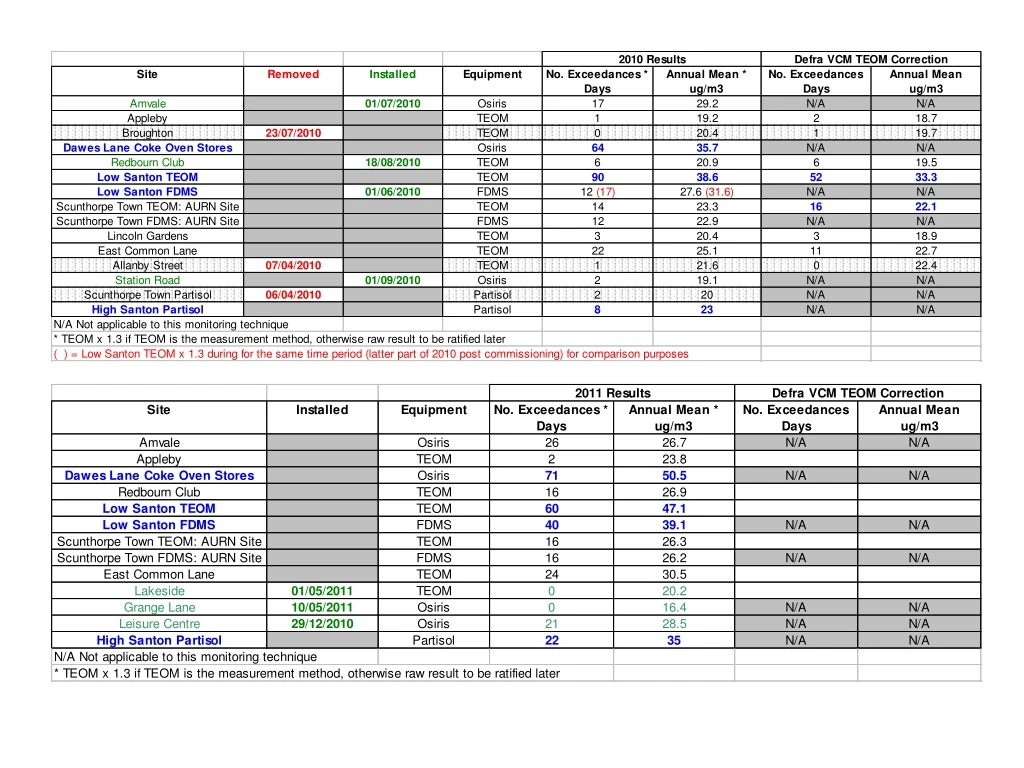
The Low Santon TEOM passed the 35 daily threshold for 2011 on the 5 th May 2011. A prolonged period of compliance in April prevented it from being the 3 rd quickest threshold breach in the data set. TEOM used as a direct comparison between previous years.

E N D
The Low Santon TEOM passed the 35 daily threshold for 2011 on the 5th May 2011. • A prolonged period of compliance in April prevented it from being the 3rd quickest threshold breach in the data set. • TEOM used as a direct comparison between previous years. • The Low Santon FDMS exceeded the 35 daily threshold on 21st May 2011.
The Low Santon Daily Mean has demonstrated a year on year reduction since 2006. • The major step change between 2007 and 2008 is because of a calculation method change (VCM). • 2011 is presented as FDMS data and will be the submitted figure for 2011. The FDMS has already exceeded with 40 breach days. • This is likely to rise. Projected totals are expected to show an increase for 2011 over 2010. • The Low Santon Annual Mean has demonstrated compliance for the last 3 years because of the VCM calculation. • Pre VCM it did not meet the objective. • Raw TEOM results do not presently meet the objective. • Data to be submitted in 2011 from the FDMS. • This will not be subject to any corrections and is already close to the objective.
It should be noted that the equivalent High Santon Partisol is currently mirroring levels that have previously led to an exceedance. • 2010 was lower at both Low Santon and High Santon although this do not appear to be the norm as previous years and 2011 show a more common pattern.
Major PM10 event on the 8th, 9th & 10th October 2010 at all Scunthorpe Sites to the West of the Works. • Wind rose highlights Easterly winds throughout the period. • Worst affected sites were Amvale and East Common Lane which are situated to the South of the Scunthorpe AQMA. • Sites over 1.2km from the boundary also affected by the event
8th October 2010 Upwind sites: Appleby 31ug/m3 Santon 37ug/m3 9th October 2010 Upwind sites: Appleby 40ug/m3 Santon 39ug/m3
28th October one of many reviews circulated as a result of breaches at Low Santon. • Differences were identified between the Low Santon TEOM and Dawes Lane Osiris. • Wind directions were calculated for these periods of difference and used to triangulate processes within the active sectors.
Each review presented a GIS map with the active sectors during the periods of interest. • The green lines indicate data during this period from the Dawes Lane Coke Oven Osiris. • The red shows the Low Santon TEOM. • The black line highlights the direction of the highest concentration during the period. • The area in which the red and green lines intersect is not likely to contain the source. • The likely sources identified in this review include: Tarmac, Redbourn Site, Slag Haul Road, Intermediate Site, Ore Beds
An alert system was initiated on the 8th March 2011. • An alert is sent following a breach of the threshold level (80ug/m3) after 06:00 and before 12:00. • Example email: “The 80ug/m3 PM10 threshold was exceeded at the Santon air quality monitoring site at 09:00 today 08/03/2011 with a concentration of 81 ug/m3.At 09:00 the wind direction was 189 ° and the wind speed was 1.8 m/s” • Example text: “The 80ug/m3 PM10 threshold was exceeded at Santon at 09:00 today with a concentration of 81 ug/m3. WD = 189o WS = 1.8 m/s No further alerts will follow today” • The alert system has correctly predicted 82% of exceedance days. • 26% of the period alerts did not go to be an exceedance day • 19% of the total exceedances went on to show a breach but did were not highlighted by the alerts • We are currently satisfied that the threshold is set at the correct level although this can be changed should operators think there are too many alerts being sent. • We have a number of phone number slots available for inclusion in these alerts and as many email slots as necessary.