Download
1 / 28
280 likes | 284 Views
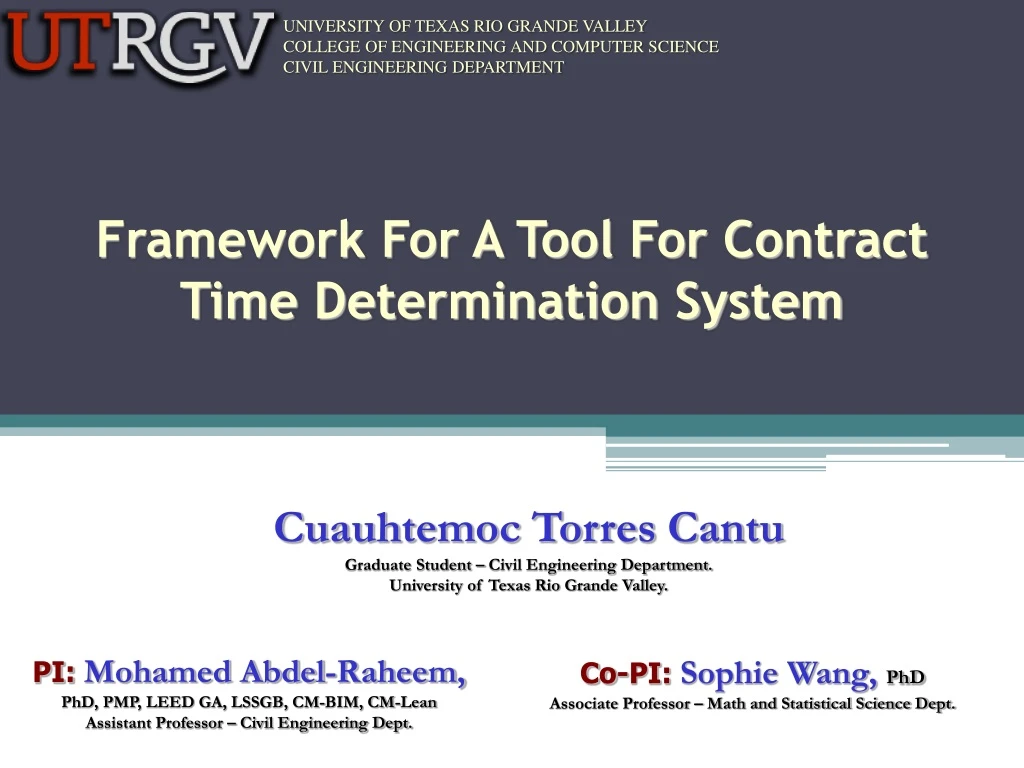
Framework For A Tool For Contract Time Determination System. UNIVERSITY OF TEXAS RIO GRANDE VALLEY COLLEGE OF ENGINEERING AND COMPUTER SCIENCE CIVIL ENGINEERING DEPARTMENT. Cuauhtemoc Torres Cantu Graduate Student – Civil Engineering Department. University of Texas Rio Grande Valley.

E N D
Framework For A Tool For Contract Time Determination System UNIVERSITY OF TEXAS RIO GRANDE VALLEY COLLEGE OF ENGINEERING AND COMPUTER SCIENCE CIVIL ENGINEERING DEPARTMENT Cuauhtemoc Torres Cantu Graduate Student – Civil Engineering Department. University of Texas Rio Grande Valley. PI: Mohamed Abdel-Raheem, PhD, PMP, LEED GA, LSSGB, CM-BIM, CM-Lean Assistant Professor – Civil Engineering Dept. Co-PI: Sophie Wang, PhD Associate Professor – Math and Statistical Science Dept.
1- Introduction • Estimating the duration time of a project is one of the most important stages in project management. • Estimated quantities and productivity rates are used to find the maximum total duration of a project. • Quantities can change once the project is in progress. • Factors that can affect productivity rates: Project Location, Size, Complexity of Work, Weather, Worker Skills, Equipment.
1- Introduction Contract Time Determination System (CTDS) • Created in 1992 by the Texas Transportation Institute and TxDOT. • Authors: Hancher, McFarland, and Alabay. • Production rate database resulted from survey inputs. It is composed of 3 values for production rates and adjustment factors (low, average, high). Highway Production Rate Information System (HyPRIS) • Created in 2004 by UT Austin in cooperation with U.S DOT, FHWA, and TxDOT • Authors: O’Connor, Chong, Huh, and Kuo. • Database established lower and higher averages for production rates, for 26 items. • HyPRIS is meant to be used as a support database rather as a scheduling tool. TxDOT have being experiencing problems estimating contract time durations. A survey conducted by UTRGV implies that TxDOT uses a combination of Engineering Experience and :
Problem Summary: • TxDOT projects get delayed; this delay costs a lot of money • Two Scheduling Tools: • Contract Time Determination System (CTDS) • Highway Production Rate Information System (HyPRIS) • The current CTDS is not accurate enough to produce reliable schedule – provides default values • HyPRIS is not a comprehensive production rate estimating system. It cannot be used alone 2- Project Problem Statement https://www.voanews.com/a/trump-healthcare-tax-reform-infrastructure/3798638.html
Objective : Develop a preliminary contract time determination tool (scheduling tool) based on probabilistic production rates. • Collect Data: collect data sets (previous and current projects) needed for tool development: a) work items/activities list, b) production rates, c) activities durations, and d) quantities of work from TxDOT • Create probability distributions for the different work items involved in a project using the provided data sets , work items should include, but not limited to : Row Preparations , Subgrade preparations , Hot mix asphalt surface , and Concrete paving. • Develop a spreadsheet-based scheduling tool implementing PERT and Monte-Carlo simulation , for the selected TxDOT Districts: Pharr , Lubbock , Bryan , Houston , and Corpus Christi. • Evaluate the performance of the developed tool in determining the project contract time: a survey soliciting feedback of engineers from the selected district offices. 3- Project Objective
4- Methodology 4.1- Project Scope The project scope is to develop a friendly excel based contract time determination tool for each of the district mentioned before. The project can be divided into two parts: • The Scheduling Tool: Development of tool using Visual Basic Application (VBA) • Development of a database for production rates based on historical data.
4- Methodology 4.2 – Creating the Database The accuracy of the contract time determination tool to predict the total duration of the project relies on the accuracy of the production rate database.
4- Methodology 4.2.1 – Data Collection At least 30 different projects of the same type of work (for example Overlay Projects) are needed. The collected data is received in report forms which include : • Contract Report Bundles (excel files) • Daily Work Summary Reports (DWR) (PDF files) • Original TxDOT timeline (when available) (PDF or Excel Files)
4- Methodology 4.2.2 – Data Extraction Data needed to be extracted include: Item Codes & Descriptions, Estimated & Actual Quantities, Unit of Measurement, Weather & Temperature Conditions, Daily Work Reported Quantity (daily production date). • Early stages performed manually; Semi automated system was developed to facilitate and save time in the data extraction process.
4- Methodology 4.2.3 – Data Analysis Data analysis performed using R integrated software for statistical data manipulation. • In this stage the database for productivity rates is created by generating a triangular distribution for each item. Triangular Distribution only requires estimates of 3 position parameters: • a can be taken as the minimum of the data • b can be taken as the maximum of the data • To estimate the mode, c, use min (i.e. a), max (i.e. b) and mean of the data (i.e. ) to estimate: c = 3* – a – b
Results of Triangular Distribution: • Item : 316-6001 ASPH (MULTI OPTION) • The production rates (GAL/day): • Minimum (pessimistic) = 550 • Mode (most likely) = 1191.8 • Maximum (optimistic)=6680 • Item : 344-6119 SUPERPAVE MIXTURES SP-D SAC-A PG70-22 • The production rates (TON/day): • Minimum (pessimistic) = 290.63 • Mode (most likely) = 946.22 • Maximum (optimistic)=1899.19
5- Contract Time Determination Tool Framework Development User-friendly tool, developed using Microsoft Excel as a base program, and Visual Basic Application (VBA) as the coding language. The software implements different scheduling techniques: • Critical Path Method (CPM) : uses deterministic durations. • Program Evaluation and Review Technique (PERT): uses probabilistic durations
PERT Takes into consideration the variability in activity duration. And this variability is defined using three estimates: • Optimistic Duration = Do • Most likely Duration = Dm • Pessimistic Duration = Dp According to the Central Limit Theorem duration of the project in PERT is represented by a normal distribution.
6- Contract Time Determination Tool Items (activities) Quantities Relationships between activities Activity Predecessor &lag User decides whether to schedule using CPM or PERT Report of : Total Duration Critical Path Gantt Chart Precedence diagram
7- Work in Progress 7.1- Precedence Diagram • Implementation of the Precedence Diagram in order to give the user a comprehensive figure of the project being scheduled. • Each activity will have ES,EF,LS,LF, Duration and relationship with other activities. • Critical Path will be marked in red color.
Our software MS Project (network diagram)
7- Work in Progress 7.2- Calendar • The Calendar will allow the user to set the working schedule manually. • Local and National Holidays will be also implemented as non working days and the user can change that. • The user will set the starting date of the project and the software will calculate the ending date of the project.
8- Future Work • Continue testing using Corpus Christi database. • Perfecting the database. • Perfecting Precedence Diagram • Perfecting the implementation of the Calendar. • Implementing Monte Carlo Simulation • Creation and implementation of database for the rest of the districts.
Acknowledgements Iwould like to show my gratitude to: • My advisors Dr. Mohamed Abdel-Raheem and Dr. Sophie Wang. • The project manager Darrin Jensen and Anette Trevino for their help in obtaining historical data from the different TxDOT Districts. • Corpus Christi and Pharrdistricts for their time and attentions given to this research, especially Tomas Trevino, David Chapa and Sergio L. Cantu.