Download
1 / 16
160 likes | 325 Views
North point (red). N. 150 ft. 18 o East Declination. 15 ft. Plot center (yellow). 15 ft. 150 ft. South point (red). Appendix A - PLOT DESIGN.

E N D
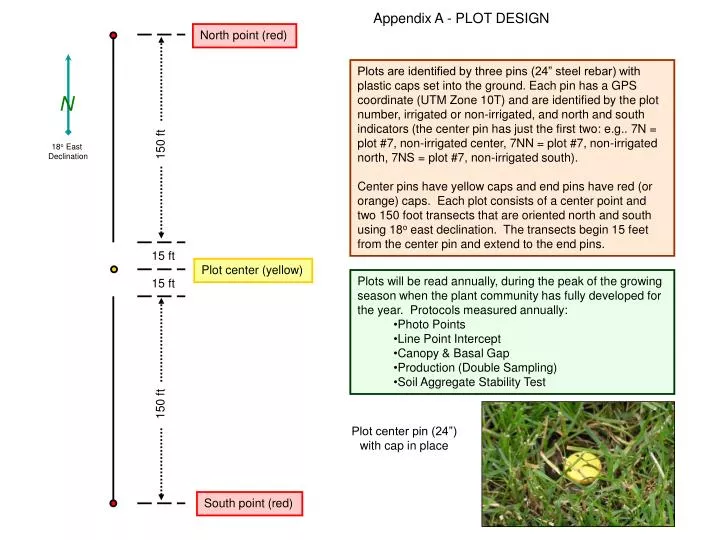
North point (red) N 150 ft 18o East Declination 15 ft Plot center (yellow) 15 ft 150 ft South point (red) Appendix A - PLOT DESIGN Plots are identified by three pins (24” steel rebar) with plastic caps set into the ground. Each pin has a GPS coordinate (UTM Zone 10T) and are identified by the plot number, irrigated or non-irrigated, and north and south indicators (the center pin has just the first two: e.g.. 7N = plot #7, non-irrigated center, 7NN = plot #7, non-irrigated north, 7NS = plot #7, non-irrigated south). Center pins have yellow caps and end pins have red (or orange) caps. Each plot consists of a center point and two 150 foot transects that are oriented north and south using 18o east declination. The transects begin 15 feet from the center pin and extend to the end pins. • Plots will be read annually, during the peak of the growing season when the plant community has fully developed for the year. Protocols measured annually: • Photo Points • Line Point Intercept • Canopy & Basal Gap • Production (Double Sampling) • Soil Aggregate Stability Test Plot center pin (24”) with cap in place
Line posts (16 ft spacing) Heavy Duty Cattle Panel (3 @ 8 ft) Subplots (6 @ 1.92 ft2) Existing fenceline 6’ Steel ‘T’ posts (3 @ 8 ft spacing) Appendix B - EXCLOSURE DESIGN Exclosures are defined by three 8” cattle panels attached (wired) to 6 ft steel ‘T’ posts. A line post on the existing fence is used as the forth side of the exclosure. Most existing fences in the area have 16 ft spacing between posts so an additional steel post may be needed to anchor one of the panels. Exclosures will be read monthly using 1.92 ft2 clipping frames and gram scales. A new area in the exclosure will be clipped month and past clipping areas will be re-clipped. Green weights will be recorded in the field and paper bagged samples will be air-dried and weighed later to determine 1) air-dry weight in grams in each subplot, and 2) percent of air-dry material at time of clipping. Dry samples in an oven at 140o F for 24 hours or air-dry at room temperature for 72 hours to obtain air-dry weight (grams air-dry * 50 = lbs./acre). • Heavy Duty Cattle Panel • 16' x 52“ • (cut in half for 8’ sections) • 1/4" Rod Diameter • 2 3/4 Gauge Rod • 47 lbs.
NORTH Transect (#NN or #IN) SOUTH Transect (#NS or #IS) 150 ft 150 ft 15 ft 15 ft 0 ft 0 ft 150 ft Line-Point Intercept: Measure intercept every 3 feet on each 150 foot transect (beginning at 3). Record top canopy, lower canopy layers, and soil surface or plant base using plant species codes (from USDA Plants Database www.Plants.usda.gov), lower canopy layer codes, and soil surface codes. Data is recorded in the Range Data Base software provided. Subplot locations shown below: 147 141 135 129 123 117 111 105 99 93 87 81 75 69 63 57 51 45 39 33 27 21 15 9 3 150 144 138 132 126 120 114 108 102 96 90 84 78 72 66 60 54 48 42 36 30 24 18 12 6 Appendix C –PROTOCOL STANDARDS (page 1) 150 ft • Top canopy codes: national species code or NONE (no canopy) • Lower canopy layers codes: national species code, L (herbaceous litter), W (woody litter, > 5 mm (~1/4 in) diameter) • Soil surface codes: national species code (for plant bases), R (rock fragment (> 5 mm (~1/4 in) diameter), BR (bedrock), M (moss), LC (visible lichen crust on soil), S (soil without any other soil surface code), EL (embedded litter), D (duff), WA (water).
Appendix C –PROTOCOL STANDARDS (page 2) Line Point Intercept Calculations [Range Database] • % Canopy Cover = [(total number of positions where Top Canopy is 'Real Plant Code')/(total number of positions completed)] * 100 • % Bare Ground = [(total number of positions where Top Canopy is 'None' AND Surface is 'S')/(total number of positions completed)] * 100 • % Basal Cover = [(total number of positions where Surface is 'Real Plant Code')/(total number of positions completed)] * 100. This calculation is also computed per species code in the same manner. • % Ground Cover Total = [(total number of positions where EITHER any Lower slot is 'L' or 'W' AND/OR Surface is NOT 'S')/(total number of positions completed)] * 100 • % Ground Cover Between Plant Canopy = [(total number of positions where Top Canopy is 'None' AND (any Lower slot has 'L' or 'W' AND/OR Surface is NOT 'S'))/(total number of positions completed)] * 100 • % Ground Cover Under Plant Canopy = [(total number of positions where Top Canopy is 'Real Plant Code' AND (any 'Lower' slot has 'L' or 'W' AND/OR Surface is NOT 'S'))/(total number of positions completed)] * 100 • % Total Litter = [(total number of positions where EITHER any Lower slot is 'L' or 'W' OR Surface is 'D' or 'EL')/(total number of positions completed)] * 100 • % Litter Between Plant Canopy = [(total number of positions where Top Canopy is 'None' AND (any Lower slot is 'L' or 'W' OR Surface is 'D' or 'EL'))/(total number of positions completed)] * 100 • % Litter Under Plant Canopy = [(total number of positions where Top Canopy is 'Real Plant Code' AND (any Lower slot is 'L' or 'W' OR Surface is 'D' or 'EL'))/(total number of positions completed)] * 100 • % All Plants = [(total number of positions where 'Real Plant Code' is 'Checked')/(total number of 'Real Plant Codes' entered)] * 100 • % Top Canopy Plants = [(total number of positions where Top Canopy is 'Real Plant Code' AND 'Checked')/(total number of positions where Top Canopy is 'Real Plant Code')] * 100 • % Top Canopy Points = [(total number of positions where Top Canopy is 'Checked')/(total number of Top Canopy positions completed)] * 100 • % Soil Surface = [(total number of positions where Surface is 'Checked')/(total number of Surface positions completed)] * 100 • Species Canopy Cover = [(total number of positions where Any Canopy Layer is 'Real Plant Code')/(total number of positions completed)] * 100
NORTH Transect (#NN or #IN) SOUTH Transect (#NS or #IS) 150 ft 150 ft 15 ft 15 ft 0 ft 0 ft 150 ft 150 ft Canopy gap (> 1.0 ft.) Canopy gap (> 1.0 ft.) Plant Canopy 7.5 to 8.7 0.4 to 1.5 Plant Base 8 7 6 5 4 3 1 0 9 Basal gap (> 1.0 ft.) Basal gap (> 1.0 ft.) Basal gap (> 1.0 ft.) 3.1 to 4.2 0 to 3.1 7.3 to 8.9 Appendix C –PROTOCOL STANDARDS (page 3) Basal and Canopy Gap: For each 150 foot transect, record the beginning and end measurement of gaps between perennial plant bases greater than 1.0 foot and between perennial plant canopy greater than 1.0 foot. Basal & Canopy Gap Calculations [Range Database] • Gap Size = end of gap - start of gap • Gap Sum (per size class) = sum of gap sizes • % of Line in Gaps (per size class) = (gap sum/line length) * 100
NORTH Transect (#NN or #IN) SOUTH Transect (#NS or #IS) 150 ft 150 ft 15 ft 15 ft 0 ft 0 ft 150 ft 150 ft Plant Production: Each 150 foot transect contains five subplots of 1.92 ft2 area at the following locations: 5, 40, 75, 110, & 145 feet. The subplot at 75 feet is clipped by species, all other subplots are estimated by weight units. Data is recorded in the Range Data Base software provided. Subplot locations shown below: R=9.4 in. 145 ft 75 ft 40 ft 5 ft 110 ft Cir=58.9 in. Appendix C –PROTOCOL STANDARDS (page 4) Harvest all current year’s growth by species. Weigh grams of each species and multiply by the conversion factor (50) to get lbs./acre green weight. Determine reconstructed annual air-dry weight using reconstruction factors [% air-dry weight, % ungrazed, % growth complete, & % of normal climate]. Plant Production Calculations [Range Database] • Plant Species Total Weight (lbs/ac) = (total wt units * wt unit wt * plot size CF * % air-dry wt. * clip/est. CF)/(utilization adj * number of sub-plots * % growth * % normal climate ) • Total Production (lbs/ac) = sum of species total weights
NORTH Transect (#NN or #IN) SOUTH Transect (#NS or #IS) 150 ft 150 ft 15 ft 15 ft 0 ft 0 ft 150 ft Soil Aggregate Stability: Each 150 foot transect has nine (9) positions for testing soil aggregate stability at 15 foot intervals starting at 15 feet. Type of plant cover is recorded at each location. Data is recorded in the Range Data Base software provided. Subplot locations shown below: 135 120 105 90 75 60 15 45 30 Sample in sieve, drawn to scale The soil sample should be no larger than ~1/4 in diameter Appendix C –PROTOCOL STANDARDS (page 5) 150 ft Soil Stability Calculations [Range Database] • Average Stability = sum of stability rankings/total number of samples completed • All Samples Taken = all samples (surface and subsurface) • Protected Samples = samples with Vegetation (Grass, Forb, Shrub, or Tree) • Unprotected Samples = samples without Vegetation (NC) • No Vegetation Specified = samples where Vegetation is left blank • Line Average = average per transect • Plot Average Stability by Vegetation Class = plot average per Vegetation class • % of Samples Equal to ‘6’ = (total number of samples where ‘Soil Stability’ is ‘6’/total number of samples completed) * 100
Appendix D – PLOT LOCATIONS (page 1) Plot 1N: 150 foot transect (1NN) Plot 1N: 150 foot transect (1NS) Plot 2N: 150 foot transect (2NN) Plot 2N: 150 foot transect (2NS) Plot 3N: 150 foot transect (3NN) Plot 3N: 150 foot transect (3NS) Plot 4N: 150 foot transect (4NN) Plot 4N: 150 foot transect (4NS)
Appendix D – PLOT LOCATIONS (page 2) Plot 5N: 150 foot transect (5NN) Plot 5N: 150 foot transect (5NS) Plot 6N: 150 foot transect (6NN) Plot 6N: 150 foot transect (6NS) Plot 7N: 150 foot transect (7NN) Plot 7N: 150 foot transect (7NS) Plot 8N: 150 foot transect (8NN) Plot N: 150 foot transect (8NS)
Appendix D – PLOT LOCATIONS (page 3) Plot 9N: 150 foot transect (9NN) Plot 9N: 150 foot transect (9NS) Plot 10N: 150 foot transect (10NN) Plot 10N: 150 foot transect (10NS) Plot 11N: 150 foot transect (11NN) Plot 11N: 150 foot transect (11NS) Plot 12N: 150 foot transect (12NN) Plot 12N: 150 foot transect (12NS)
Appendix D – PLOT LOCATIONS (page 4) Plot 13N: 150 foot transect (13NN) Plot 13N: 150 foot transect (13NS) Plot 14N: 150 foot transect (14NN) Plot 14N: 150 foot transect (14NS) Plot 15N: 150 foot transect (15NN) Plot 15N: 150 foot transect 15(NS) Plot 16N: 150 foot transect (16NN) Plot 16N: 150 foot transect (16NS)
Appendix D – PLOT LOCATIONS (page 5) Plot 17N: 150 foot transect (17NN) Plot 17N: 150 foot transect (17NS) Plot 18N: 150 foot transect (18NN) Plot 18N: 150 foot transect (18NS) Plot 1I: 150 foot transect (1IN) Plot 1I: 150 foot transect (1IS) Plot 2I: 150 foot transect (2IN) Plot 2I: 150 foot transect (2IS)
Appendix D – PLOT LOCATIONS (page 6) Plot 3I: 150 foot transect (3IN) Plot 3I: 150 foot transect (3IS) Plot 4I: 150 foot transect (4IN) Plot 4I: 150 foot transect (4IS) Plot 5I: 150 foot transect (5IN) Plot 5I: 150 foot transect (5IS) Plot 6I: 150 foot transect (6IN) Plot 6I: 150 foot transect (6IS)
Appendix D – PLOT LOCATIONS (page 7) Plot 7I: 150 foot transect (7IN) Plot 7I: 150 foot transect (7IS) Plot 8I: 150 foot transect (8IN) Plot 8I: 150 foot transect (8IS) Plot 9I: 150 foot transect (9IN) Plot 9I: 150 foot transect (9IS) Plot 10I: 150 foot transect (10IN) Plot 10I: 150 foot transect (10IS)
Appendix D – PLOT LOCATIONS (page 8) Plot 11I: 150 foot transect (11IN) Plot 11I: 150 foot transect (11IS) Plot 12I: 150 foot transect (12IN) Plot 12I: 150 foot transect (12IS) Plot 13I: 150 foot transect (13IN) Plot 13I: 150 foot transect (13IS) Plot 14I: 150 foot transect (14IN) Plot 14I: 150 foot transect (14IS)
Appendix D – PLOT LOCATIONS (page 9) Plot 15I: 150 foot transect (15IN) Plot 15I: 150 foot transect (15IS) Plot 16I: 150 foot transect (16IN) Plot 16I: 150 foot transect (16IS) Plot 17I: 150 foot transect (17IN) Plot 17I: 150 foot transect (17IS) Plot 18I: 150 foot transect (18IN) Plot 18I: 150 foot transect (18IS)