Download
1 / 34
350 likes | 473 Views
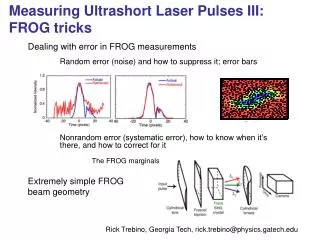
Dynamics of Non-Equilibrium States in Solids Induced by Ultrashort Coherent Pulses. Claudio Giannetti. INFM and Università Cattolica del Sacro Cuore Dipartimento di Matematica e Fisica, Via Musei 41, Brescia. Photodiode. e -. reflectivity variation. 10-100 fs. Introduction.

E N D
Dynamics of Non-Equilibrium States in Solids Induced by Ultrashort Coherent Pulses Claudio Giannetti INFMand Università Cattolica del Sacro Cuore Dipartimento di Matematica e Fisica, Via Musei 41, Brescia.
Photodiode e- reflectivity variation 10-100 fs Introduction High-Intensity femtosecond coherent pulses → Investigation of Photoinduced non-equilibrium states in solids pump Photoemission sample Spectrometer probe
Introduction High-Intensity femtosecond coherent pulses → Investigation of Photoinduced non-equilibrium states in solids • Time-resolved non-linear photoemission on METALS. • [W.S. Fann et al., Phys. Rev. Lett. 68, 2834 (1992)] • [U. Höferet al., Science 277, 1480 (1997)] • [G. Ferrini et al., Phys. Rev. Lett. 92, 2668021 (2004)] • Structural and electronic phase transitions in SOLIDS and MOLECULAR CRYSTALS. • [A. Cavalleri et al., Phys. Rev. Lett. 87, 2374011 (2001)] • [E. Collet et al., Science 300, 612 (2003)]
Introduction OPTICAL CONTROL OF ELECTRON INTERACTIONS AND PHASE TRANSITIONS IN TWO SPECIFIC SYSTEMS: • Image Potential States on Ag(100) • By selecting the excitation photon energy it is possible to investigate the properties of IPS in different regimes. • Insulator-Metal phase transition of VO2 • By selecting the excitation photon energy it is possible to clarify the physical mechanisms responsible for the photoinduced phase-transition.
Ag(100) IPS on Ag(100) IMAGE-POTENTIAL STATES (IPS) IPS: 2-dim electron gas in the forbidden gap of bulk states Image Potential: Eigenvalues: • Ry: Rydberg-like • Constant • n=1, 2,… • m* : electron effective mass P.M. Echenique et al., Surf. Sci. Rep. 52, 219 (2004).
IPS on Ag(100) MEASUREMENTS on IPS • Relaxation dynamics • IPS effective mass Important test for many-body theories (GW) Electron self-energy Electron Green function Screened interaction potential damping: Γ = 1/τ= ImΣ* Effective mass: ok+ ReΣ*≈ħ2k2/2m* Quasi-particle Energy spectrum
Source: Amplified Ti:SapphireOscillator Pulse width: 150 fs Rep. rate: 1kHz Average power: 1W Wavelenght: 790nm (1.57eV) Travelling Wave Optical Parametric Generator ToF • TOPG • Tunability 1150-1500 nm • (0.8-1.1 eV) • Pulse width 150 fs • Average power 50mW e- sample UHV IPS on Ag(100) EXPERIMENTAL SET-UP Energy resolution:10 meV @ 2eV 4th 4.2eV 2nd 2.1eV
ToF 150 fs hν= 4.2 eV > Φ IPS on Ag(100) NON-LINEAR PHOTOEMISSION on IPS Ekin = hν - En τ = ħ / Γ Population of empty states via resonant 2-photon photoemission Phys. Rev. B 67, 235407 (2003)
IPS on Ag(100) ANGLE-RESOLVED PHOTOEMISSION on IPS m*/m=0.970.02 in agreement with calculated values → 2-dimensional free electron gas Phys. Rev. B 67, 235407 (2003)
Non-Equilibrium Electron Distribution NON-LINEAR PHOTOEMISSION on METALS when hν < Φa non-equilibrium electron population is excited in the s-p bands of Ag • investigation of the non-equilibrium electron distribution • ↓ • Excitation mechanisms • Relaxation dynamics • Photoemission processes
Free-electron dispersion E Δk|| ΔE k|| Non-Equilibrium Electron Distribution • PHOTON ABSORPTION MECHANISMS • PROBLEMS: The intraband transition between s-s states within the same branch is FORBIDDEN for the conservation of the momentum. • Recently the excitation mechanism has been attributed to: • Laser quanta absorption in electron collisions with phonons. • [A.V. Lugovskoy and I. Bray, Phys. Rev. B60, 3279 (1999)] • Photon absorption in electron-ion collisions. • [B. Rethfeld et al., Phys. Rev. B65, 2143031 (2002)] THE ENERGY ABSORPTION IS DUE TO A THREE-BODY PROCESS AND NOT TO A DIPOLE TRANSITION
Non-Equilibrium Electron Distribution NON-LINEAR PHOTOEMISSION on Ag The excitation of a non-equilibrium electron population results in a high-energy electron tail: E > nhν-Φ hν=3.14eV Occupied states n=1 IPS Log Scale 106 sensitivity hν 2-Photon Photoemission with p-polarized light Non-equilibrium Distribution Iabs=13 μJ/cm2
Non-Equilibrium Electron Distribution We exclude: • Coherent 3-photon photoemission • Direct 3-photon photoemission • ↓ • Scattering-mediated transition The high-energy electron tail is a fingerprint of the non-equilibrium electron distribution at k||≠0 submitted to Phys. Rev. B
Non-Equilibrium Electron Distribution • NON-EQUILIBRIUM ELECTRON DYNAMICS • RESULTS: Time-Resolved Photoemission Spectroscopy Photemitted charge autocorrelation of different energy regions The Relaxation Time of the high-energy region is τ<150 fs Fermi-liquid submitted to Phys. Rev. B
Non-Equilibrium Electron Distribution • ENERGY TRANSFER • non-equilibrium electrons • ↓ • Equilibrium distribution Two-temperature model: The heating of the equilibrium distribution can be neglected submitted to Phys. Rev. B
IPS as a Probe of Non-Equilibrium Distribution IPS INTERACTING WITH NON-EQUILIBRIUM ELECTRON DISTRIBUTION hν= 3.14 eV < En-EF NO DIRECT POPULATION Iinc= 300 μJ/cm2 0% d→d ρe~ 1020 cm-3 hν= 4.28 eV > En-EF RESONANCE Iinc= 30 μJ/cm2 90% d→d ρe~ 2∙1018 cm-3 when hν= 3.14 eV a high-density non-equilibrium electron distribution cohexists with electrons on IPS Phys. Rev. Lett 92, 2568021 (2004)
Dispersion of IPS in k||-space Fermi edge Ag(100) n=1 hν=3.15eV hν=3.54eV IPS as a Probe of Non-Equilibrium Distribution IMAGE POTENTIAL STATE Ag(100) Ekin = hν-Ebin Ebin 0.5 eV n=1 K||=0 Shifting with photon energy Δhν=0.39eV Phys. Rev. Lett 92, 2568021 (2004)
Indirect population of IPS Ag(100) Ev n=1 Scattering Assisted Population and Photoemission NO DIPOLETRANSITION Φ empty states EF occupied states IPS as a Probe of Non-Equilibrium Distribution • ELECTRIC DIPOLE SELECTION RULES • RESULTS: Expected dipole selection rules: J=0 in S-pol J≠0 in P-pol Dipole selection rules Violated in non-resonant case Respected in resonant case Phys. Rev. Lett 92, 2568021 (2004)
IPS as a Probe of Non-Equilibrium Distribution IPS EFFECTIVE MASS s-polarization m*/m = 0.88±0.04 p-polarization m*/m = 0.88±0.01 2-D electron system interacting with 3-D electron system Role of IPS interaction with the non-equilibrium distribution in W Phys. Rev. Lett 92, 2568021 (2004)
Insulator-Metal Phase Transition in VO2 Insulator-Metal Phase Transition in VO2 Insulator-to-Metal photoinduced phase transition in VO2 Solid State properties in highly non-equilibrium regimes
Temperature-Driven IMPT in VO2 High-T Rutile phase Conductor Low-T Monoclinic phase Insulator: Egap~0.7 eV Tc=340K 3d energy levels [S. Shin et al., Phys. Rev. B 41, 4993 (1990)]
Origin of the Insulating Band-Gap Origin of the insulating band-gap: electron-electron correlations in the d|| band (Mott-Hubbard insulator) IMPT Dynamics: the electronic structure stabilizes the distorted Monoclinic phase minimization of the ground-state lattice energy (Peierls or band-like insulator) IMPT Dynamics: a phononic mode drives the phase transition A comprehensive review: [M. Imada et al.., Rev. Mod. Phys. 70, 1039 (1998)]
Photo-Induced IMPT in VO2 The Insulator-to-Metal phase transition can be induced by ultrashort coherent pulses. τ=150 fs hν=1.55 eV I=10 mJ/cm2 [M. Becker et al.., Appl. Phys. Lett. 65, 1507 (1994)] Questions opened: • It is the same structural and electronic phase transition? • Structural and electronic transitions are simultaneous? • Which is the mechanism driving the highly • non-equilibrium phase transition?
Photo-Induced IMPT in VO2 • It is the same structural and electronic phase transition? Structural YES Electronic ? probe: hν=1.55 eV structural dynamics τ~500 fs electronic dynamics τ~500 fs [M. Becker et al.., Appl. Phys. Lett. 65, 1507 (1994)] [A. Cavalleri et al.., Phys. Rev. Lett. 87, 2374011 (2001)]
Optical Properties of VO2 @ 790 nm ΔR/R ~ -20% [H. Verleur et al., Phys. Rev. 172, 788 (1968)] DRUDE Harmonic Oscillator
Experimental Set-Up time-resolved (τ~150 fs) near-IR (0.5-1 eV) reflectivity PUMP + PROBE three-layer sample
Ein Eout Near-IR Reflectivity 0.5-1 eV reflectivity: signature of the band-gap Multi-film calculation L1 L2 L1=20 nm L2=330 nm
Femtosecond Band-Gap Closing The Insulator-to-Metal phase transition is induced by 1.57 eV-pulses and probed by0.54 eV-pulses(under gap) Signature of Femtosecond band-gap closing 150 fs
Photo-Induced IMPT Mechanism • Which is the mechanism driving the highly • non-equilibrium phase transition? • Removal of the d|| • electron-electron correlations→ • band-gap collapse and lattice stabilization π* e- • Coherent excitation of the phonon responsible of the IMPT→ • lattice transition and electronic rearrangment d|| hole - doping with Ipump>10 mJ/cm2 hole-doping ~ 20-100% In this experimental scheme it is not possible to discriminate!
Photo-Induced IMPT Mechanism Near-IR photoinduction of the phase transition in the under-gap region the hole-doping is highly reduced π* e- 0.7 eV d|| hole - doping we can discriminate between the two mechanisms
Near-IR Photoinduction of the IMPT ZOOM: IMPT completed in 150 fs: NO thermal effect Pump:0.95 eV Probe:1.57 eV-pulses (under gap) Two dynamics: τ1=200 fs τ2=1000 fs Metastable metallic phase
Near-IR Photoinduction of the IMPT The Insulator-to-Metal phase transition can be induced in the under-gap region, through near-IR pulses (0.5-1 eV) The pump fluence necessary for the IMPT is about constant!
Conclusions We have demonstrated that selecting a particular excitation channel: • It is possible to investigate IPS on Ag interacting with a photoinduced non equilibrium electron distribution • It is possible to photoinduce the IMPT of VO2 and clarify the physical mechanisms responsible for the VO2 electronic properties
Publications • G. Ferrini, C. Giannetti, D. Fausti, G. Galimberti, M. Peloi, G.P. Banfi and F. Parmigiani, Phys. Rev. B67, 235407 (2003). • G. Ferrini, C. Giannetti, G. Galimberti, S. Pagliara, D. Fausti, F. Banfi and F. Parmigiani, Phys. Rev. Lett.92, 2568021 (2004). • C. Giannetti, G. Galimberti, S. Pagliara, G. Ferrini, F. Banfi, D. Fausti and F. Parmigiani, Surf. Sci.566-568, 502 (2004). • G. Ferrini, C. Giannetti, S. Pagliara, F. Banfi, G. Galimberti and F. Parmigiani, • in press on J. Electr. Spectrosc. Relat. Phenom. • F. Banfi, C. Giannetti, G. Ferrini, G. Galimberti, S. Pagliara, D. Fausti and F. Parmigiani, • accepted for publication on Phys. Rev. Lett. • C. Giannetti, S. Pagliara, G. Ferrini, G. Galimberti, F. Banfi and F. Parmigiani, • submitted to Phys. Rev. B. • E. Pedersoli, F. Banfi, S. Pagliara, G. Galimberti, G. Ferrini, C. Giannetti and F. Parmigiani, • in preparation.