Download
1 / 44
440 likes | 600 Views
BackgroundMaterials and MethodsResultsDiscussion. Background. The Genotype contain much more information than what is used by any one particular cell at any given point in time.Thus, all the cells use a common genomic library giving rise to different types of cells- by a process called different

E N D
1. Transcriptome profiling and sequencing of differentiated human hematopoietic stem cells reveal lineage specific expression and alternative splicing of genes. Naga Sridhar Betrapally
Sarita Limbu
Yogesh Joshi
2. Background
Materials and Methods
Results
Discussion
3. Background The Genotype contain much more information than what is used by any one particular cell at any given point in time.
Thus, all the cells use a common genomic library giving rise to different types of cells- by a process called differentiation.
The signals responsible for differentiation are transmitted from one generation to the next without any change in the original DNA sequence of the cell.
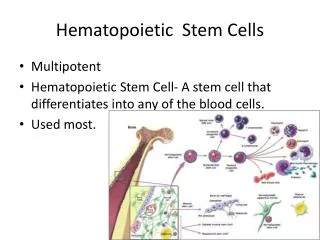
4. The Stem Cells
Undifferentiated Stem cells scattered throughout .
Differentiate into daughter cells: which have two possible fates.
5. Hematopoiesis Complete functioning in terms of function:
Transport gases (Erythrocytes),
Prevent bleeding (platelets),
Form a solid Immune System (defense).
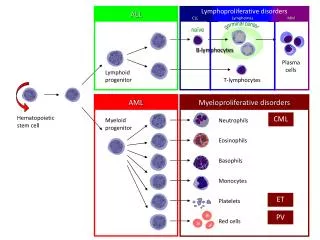
6. Hematopoietic and progenitor cell lineages.
7. Contd.. All the progenitor populations can be separated as pure populations by using cell surface markers.
MODEL: human hematopoietic model system where lineage specific differentiation of CD34+ cells.
The progenitor stem cell can be induced to enter into specific differentiation pathways by external stimuli: Growth Factors.
8.
Materials & Methods
9. Materials
10. Differentiation
11. Flow Cytometry and RNA Isolation Cells were characterized by dual color immunofluorescence using a BD FACSCanto flow cytometer.
Erythropoietic cells characterized by staining with anti � CD71 FITC antibody, Megakaryopoietic cells characterized by staining with anti � CD61 FITC antibody and Granulopoietic cells characterized by staining with anti � CD15 FITC antibody.
Morphology tests, viable cells analysis.
Micrographs of these cells were taken with a Leica Microscope.
For RNA extraction, Genomic DNA was removed by using gDNA eliminator spin columns.
Obtained RNA was then quantified for concentration, quality and integrity.
12. Target Preparation, Hybridization for Microarrays
13. Microarray Data Collection, Annotation and Principal Component Analysis Exon level core robust multiarray average (RMA) sketch intensity values � Affymetrix Expression Console Software.
Total of 287, 329 probe sets were mapped to human genome build hg18 using Affymetrix probe set selection region.
Probe sets were then mapped to genes and exons using a reduced RefSeq gene model.
Gene model allows to test for alternative splicing.
This process yielded 174, 792 distinct exons grouped into 17, 457 genes.
12 Chip data was subjected to Principal Component Analysis.
Four conditions, i.e CD34+, Erythropoietic cells, granulocytes, megakaryocytes were triplicated for accuracy on PCA.
14. Analysis of Exon Arrays by ExonSVD ExonANOVA has been widely used for analysis of exon arrays.
This model makes strong assumptions, fails when the probe set has low sensitivity or if values become saturated.
These situations create problems in detection of alternative splicing.
Authors introduce a new analytical method, ExonSVD model to overcome limitations of ExonANOVA.
This model removes the need to detect and remove dead, unresponsive probe-sets.
15. Selection, Expression and Identification of Genes �
16. Next Generation Sequencing � SOLiD Sequencer Library preparation
RNA from CD34+, E cells depleted of rRNA
Fragmented RNA selected using flashPAGE fractionation
RNA fragments of 50 to 150 nucleotides
Converted to cDNA, amplified by PCR
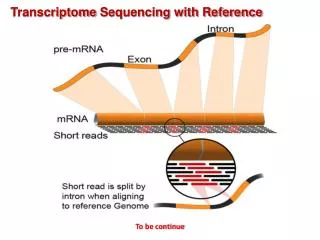
Sequence read processing and alignment
mRNA-Seq reads analyzed using ABI transcriptome software
Sequence reads were then aligned to human genome using ABI Analysis Pipeline Tool
Aligned reads were mapped to RefSeq exons downloaded from UCSC Genome browser
Read per kilobase per million reads (RPKM) values were obtained for each RefSeq exon.
RPKM values were used for further analysis with microarray data
17. RNAseq, Microarray Data Correlation RNAseq data compared to the microarray data at the exon level
RefSeq exon RPKM values matched to corresponding reduced model exon microarray RMA values
Yielded 149, 765 RNAseq microarray value pairs
Correlations based on exon level fold changes, gene level changes were determined
18. QPCR Analysis to Determine Gene Expression Values cDNA synthesized from RNA
Quantative real � time PCR assays were carried out with use of specific double fluorescently labeled probes in a 7900 Sequence Detector
PCR amplification was performed and samples were analyzed in duplicate.
CT values were normalized to housekeeping gene � actin
Comparitive CT method used to find relative fold changes in gene expression
19.
Results
20. Flow cytometry characterization PE � phycoerythrin fluorescent dyePE � phycoerythrin fluorescent dye
21. Micrographs taken with Leica microscope
22. To determine expression levels of some lineage-specific genes using QPCR.
23. To confirm lineage-specific differentiation, microarray-based expression of lineage-specific genes
24. Micro-array based confirmation of differentiated cells by PCA The bi-plot of PC1 vs PC2 along which the data have the largest spread or variability. The bi-plot of PC1 vs PC2 along which the data have the largest spread or variability.
25. Hierarchical cluster analysis Venn Diagram:
M: 148 genes, G: 52 genes
E: 70 genes
26 genes: commonly differen-
tially expressed in all 3 groups.
Hierarchical Cluster analysis:
172 differentially expressed genes
Criteria:
P-value = 10^-7
Fold change > 2 for a any 3 comparisons.
29. Identification of up-regulated genes
Criteria:
P-value = 10^-4
Largest fold change > 2 in that particular
cell type
no fold change >1.4 in other cell type
331 Up regulated transcripts
E: 32, G: 30, M: 269 genes
30. Gene ontology analysis to determine molecular functions using Ingenuity Pathway Analysis
31. Validation of differentially expressed genes by QPCR
32. Successful validation of Alternative Splicing
An alternatively spliced gene is a gene with at least one exon whose behavior deviates by a certain magnitude relative to the other exons within the gene.
31 alternatively spliced genes found to be in common.
14 genes common to E and G groups,
11 genes common to E and M groups,
5 genes common to G and M groups.
33. Correlation Values Gene Level:
R = 0.72
Exon Level:
R = 0.62
The genes having high correlation values in the range of 0.83 to 0.91.
38.
Discussion
39. Discussion The unique functions of blood cells are acquired during differentiation.
Paper deals with the role played by the Transcriptome in Hematopoiesis.
Erythropoietic cells (CD71) vs CD34,
Granulopoietic cells (CD15) vs CD34.
Megakaryopoietic cells (CD61) vs CD34.
40. Initial Microarray: 172 modulated genes.
Ingenuity Software Analysis.
Transcript analysis :
30 transcripts: E group,
32 transcripts: G group,
269 transcripts: M Group.
41. Erythropoietic differentiation:
GTPase Activator Proteins.
Megakaryopoietic differentiation:
Homeostasis and Platelet Formation.
ExonSVD Model showed 86 known genes to be alternately spliced among the progenitors that are related to Hematological system and development.
42. Impact on Pathways These changes of gene expression have a direct impact on:
Rac and Rho Signaling Pathway,
Leukocyte extra vascular signaling,
Wnt/B-catenin signaling
Alanine and Aspartate Metabolism;
Actin based mobility by Rho.
43. In Summary Whether or not each of these genes play a role in hematopoietic differentiation will require additional studies.
Self-renewal and differentiation of HSC is not governed by a single or few factors but by integration of many signal inputs affecting gene transcription
44. References Transcriptome profiling and sequencing of differentiated human hematopoietic stem cells reveal lineage � specific expression and alternative splicing of genes
Poching Liu, Jennifer Barb, Kimberly Woodhouse, James G. Taylor VI, Peter J. Munson, and Nalini Raghavachari