Download
1 / 29
290 likes | 396 Views
World Health Organization. Resource Allocation for Malaria Prevention. Final Presentation April 17, 2008. Michele Cataldi • Christina Cho • Cesar Gutierrez • Jeff Hull • Phillip Kim • Andrew Park. Sponsor Contact: Jason Pickering, PhD. Faculty Advisor: Julie Swann, PhD.

E N D
World Health Organization Resource Allocation for Malaria Prevention Final PresentationApril 17, 2008 Michele Cataldi • Christina Cho • Cesar Gutierrez • Jeff Hull • Phillip Kim • Andrew Park Sponsor Contact: Jason Pickering, PhD. Faculty Advisor: Julie Swann, PhD. Disclaimer: This document has been created in the framework of a senior design project. The Georgia Institute of Technology does not officially sanction its content.
Agenda • Client Background • Problem Description • Solution Strategy • Model • Deliverables • Value
Client Background • World Health Organization • Responsible for providing leadership to all UN member nations on global health matters • Public Health Mapping Group • Data analysis, process and visualization via Geographic Information Systems (GIS)
Problem Description • Malaria • 300-500 million cases per year and over 1 million deaths • Prevention methods • Indoor Residual Spraying (IRS) • Long-Lasting Insecticide Treated Bed Nets (LLIN) • No existing procedure for optimal allocation of limited prevention resources • Arbitrary distribution • Detrimental effects of excessive spraying
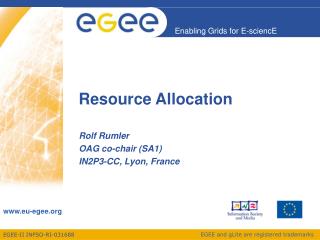
Solution: Strategy • Create a systems-based approach to minimize the incidence of malaria with limited resources. • Swaziland as pilot country • Historical data availability • Wide range of conditions http://www.mara.org.za/ http://en.wikipedia.org/wiki/Swaziland
Data Sources • Mapping Malaria Risk in Africa (MARA) • Percentage risk estimation by region • 5x5 km spatial resolution • Start and end months of high malaria transmission http://www.mara.org.za/ http://www.mara.org.za/
Data Sources • HealthMapper Road Infrastructure Facility Infrastructure
Data Sources • Costs and other intervention data • World Health Organization Malaria Costing Tool • UN Millennium Project
Model Objective • An optimization model will allow for a systems-based approach to resource allocation and deployment for malaria prevention. • Decisions include: • Where to locate Distribution Centers (DCs) • How many DCs to open • When DCs should be open • What regions DCs should serve • When to cover each zone • Number of people to protect in each zone • Labor, trucks, equipment, insecticide/nets to base at DCs • Labor, trucks, equipment to allocate to each zone
Model Overview DC Placement Heuristic Zone Assignment Heuristic Resource Deployment Model Decision Tool
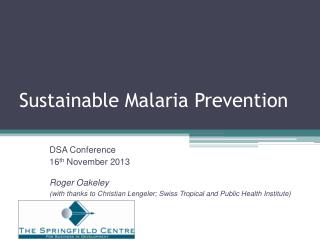
DC Placement Heuristic • Potential locations for DCs • Factors considered: • Population • Malaria risk • Infrastructure • Scalable for other countries • Distance constraints adjusted by estimated area Max. distance from center point: Min. distance between DCs: *where d represents ½ the (estimated) height of the country, and n the number of DCs
DC Placement Heuristic Swaziland: 5 DC Placement MalariaRisk Population
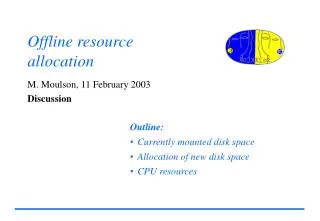
Zone Assignment Heuristic • Customer zones are serviced by a single DC • Straight-line distance: DC to customer zone • Road factor of zone considered (paved, unpaved) Zone Assignment with 3 DCs Zone Assignment with 5 DCs
IRS Resource Deployment Model • Objective: Maximize the number of people protected by a prevention method who are at risk of malaria. • Output: scheduled deployment plan • What zones to target for spraying • When to deploy in each zone • How many people in each zone to protect • Resources to base at DCs
Assumptions • MARA • Risk and transmission season accurately represented by MARA • 5x5 km MARA grids aggregated into ~15x15 km zones • Intervention • IRS with DDT • Materials ordered once per year, prior to deployment • 1 spray cycle per year • Straight line distances adjusted for road conditions of zone Distribution Center Zone(s) Zone(s) Zone(s) …… Zone(s) …… time 1 time 2 time 3 time T
IRS Constraints • Deployment restricted by:
LLIN Resource Deployment Model Advertisement of net pickup place and time to zones DCs open for net pickup and instruction on proper use • Adapted output • When to open the DCs • What zones to target • Number of public health workers and supervisors at DCs • Extent of advertising in targeted zones time(0) ... time (DC open) time(DC open) ... time (DC close) Zone(s) Zone(s) Zone(s) Zone(s) DC DC Zone(s) Zone(s) Zone(s) Zone(s)
Recommendation • Labor based at each DC
Recommendation • Deployment schedule *For full deployment schedule, see animation
Model Interface • Decision-making application using Excel and VBA • Linked to Xpress-MP
Deliverables • Optimization model • Description, specification of model • Decision-making tool • Test interface in Excel • Output • Sensitivity analysis • Objective response to changes in parameters • Documentation • All assumptions, processes, and methodology
Value • Use of heuristics to estimate expected current deployment behavior • 3 heuristic variations, prioritize zones to cover by: • Greatest risk first • Greatest population first • Greatest combined risk and population first • All variations assume: • 1 DC in Mbabane (capital) • Equivalent objective, budget, and resource constraints
Value *The American Society of Tropical Medicine and Hygiene, http://www.ajtmh.org/cgi/reprint/77/6_Suppl/138
Value Africa alone loses an average of 12 billion US dollars of income per year, because of malaria. WHO/Gates Foundation Project Malaria Atlas Project http://www.map.ox.ac.uk
Summary • Problem Description • Solution Strategy • Model • Recommendations • Value