Download
1 / 22
220 likes | 224 Views
Measurement Needs for AQ Models. Paul Makar Air Quality Research Branch, Meteorological Service of Canada, Environment Canada. Points to be covered:. What kind of data have been used in the past (by MSC) for model evaluation?. How have these data been used?.

E N D
Measurement Needs for AQ Models Paul Makar Air Quality Research Branch, Meteorological Service of Canada, Environment Canada
Points to be covered: What kind of data have been used in the past (by MSC) for model evaluation? How have these data been used? What are their limitations / benefits? Some ideas on what would be useful for future work.
AQ Model/Measurement Comparisons: Three types of data for comparisons: • Laboratory / Process Studies • Monitoring Networks • Measurement Intensives
Laboratory / Process Studies Represent transition between “pure” and “applied” science. Fundamental basis for every component of an AQ model. Some examples: Smog chamber data for gas-phase mechanism evaluation
Laboratory / Process Studies Slope = 0.64 R2 = 0.90 Slope = 0.85 R2 = 0.72 Slope = 0.46 R2 = 0.98 Represent transition between “pure” and “applied” science. Fundamental basis for every component of an AQ model. Some examples: Comparison of laboratory water uptake on organics to absorptive partitioning model results.
Laboratory / Process Studies Last example: 1-D column model of Isoprene emissions and chemistry. Sensitivity of isoprene emissions measurements to chemical loss: 30% underestimate in emission possible.
Laboratory and Process Studies are necessary for improvements to science in regional AQ models! • Test the model components as stand-alone processes, • if possible. • (2) Test them in the complete AQ model and compare to • monitoring and measurement intensive data.
Monitoring Networks: • Multiple locations across a wide spatial domain. • Long time periods available. • Limited chemical speciation. • Limited time intervals (24 hr averages, 1 day in 3 or 1 day in 6) Evaluation of model over a wide range of locations, hence over a wide range of conditions. The “depth” of the evaluation is limited by the lack of detail (speciation and time interval).
Example: An AURAMS model grid showing measurement intensive (Pacific2001) and Monitoring sites: Intensive Monitoring Networks Better representation over domain, but less detailed data. Very detailed data, but only at a few sites,
Useful for different things: Monitoring networks can be used to get scatterplots. e.g. this shows that the model is over-predicting particle nitrate – it doesn’t tell you why.
Measurement Intensives: • Highly speciated • High time-resolution • Data only available at small number of sites. • Measurements are for a limited total time. e.g. measurement intensive data showed precursor to particle nitrate was being over-predicted. The point: if you want to determine the cause of an inconsistency between model and measurements, you need the highest amount of speciation and time resolution possible.
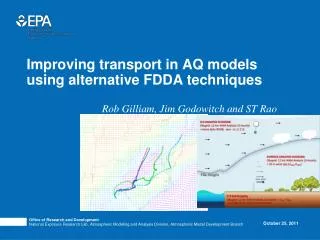
New Directions for AQ Measurement - Model Interactions: • Monitoring Networks: • Provide real-time data for AQ forecast evaluation and data assimilation. Continuous monitoring of some species at high time resolution starting. • Adjoint models under construction for data assimilation of air quality variables (to improve AQ model forecast skill).
New Directions for AQ Measurement - Model Interactions: • Measurement Intensives: • On-site model-measurement links: AQ models are being used to drive measurement intensive programs. E.g. MSC contribution to ICARTT • MSC contribution: study on cloud processes and cloud chemistry. • Resulted from the research staff being asked, “What measurements could be made that would provide the most useful data for model improvement.” • AQ Model simulations used to help determine site location. • AQ Model forecasts to be run to determine aircraft flight plans.
Some thoughts on “user needs”: What suite of measurements are needed to support model evaluation? How much money do you have to spend? I want measurements of everything, on 5 minute time intervals, every 3 km, over the entire planet. Failing that… The monitoring networks currently in place across North America are sufficient to evaluate an AQ model’s performance. (Operational Evaluation) The monitoring networks currently in place across North America are NOT sufficient to evaluate the causes behind an AQ model’s performance. (Diagnostic Evaluation)
The monitoring networks currently in place across North America are sufficient to evaluate an AQ model’s performance. (Operational Evaluation) Why? Already measuring O3, PM2.5, PM10 mass at high time resolution, PM speciation at low time resolution. Sufficient to “evaluate” a forecast of these species. Not sufficient to explain the reason for a poor forecast. The monitoring networks currently in place across North America are NOT sufficient to evaluate the causes behind an AQ model’s performance. Why? High time resolution, simultaneous measurements of PM, O3 and precursors are not available in the networks. Need: speciated VOCs, HNO3, NH3, NOx, SO2 at high time resolution, ditto for PM speciation.
How do we treat point-measurement versus grid-prediction incommensurability? (1) Is the measurement location representative of the grid-square? This is a model grid-square. 0.85 Its concentration is valid at the point in the centre. Assumed to represent the entire square. 0.82 0.78 0.35 0.85 0.75 This is a measurement site. 0.61 0.65 Is its concentration representative of the entire grid-square? 0.99 Make ten simultaneous measurements. Calculate the slope and correlation between the proposed site and the others. If the correlation is high, the slope is 1, and the intercept is small: the within-grid-square variability is low, and one site will be sufficient to characterize the grid square. Some grid squares may be better than others!
(2) Is the measurement location representative of the region? Use the same strategy as above; how do the sites correlate across the region? (3) Is the model grid-square representative of the larger region? Use a similar strategy: are the model results at the grid-square well correlated with others in the surrounding region? The point: some statistics on measurements and model results across the domain will quantify “incommensurability”.
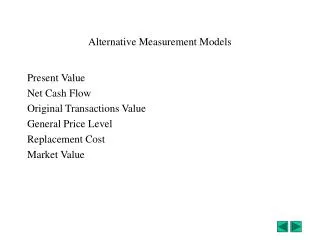
What suite of measurements are needed to establish that we have met the requirements of the control programs in terms of achieving the target reductions in air concentrations? Depends: If the target reductions are for total PM, you measure total PM. O3 O3 PM2.5 PM2.5 But, if you want to know why the control programs are working or not, or if they’re working for the reasons you think they are, you need to look at other species, more detailed time resolution (Diagnostic level – wish list coming).
How does measurement error affect model evaluation? Depends: Measurement limitations or bias, if unreported, will result in a lot of (possibly) wasted effort on model “improvements”. In the absence of information to the contrary, the measurements will be assumed to have no errors, no bias, and to be an exact representation of reality. What are model evaluation goals? Operational (forecast): Is it giving the right result? Diagnostic (Control strategy): Is it giving the right result for the right reason?
Wish list for Control Strategy / Diagnostic Model Development: OC PM speciation: PM measurements analyzed using New Directions methods (see yesterday’s talks) to get Humic-Like Substances, polymer chains, and their precursors identified. Transport: Aircraft as well as surface-based measurements, Lidar for determining aerosol layering structure. Meteorology: How well does the met. model simulate local as well as synoptic meteorology? Process-Specific Studies at multiple sites with: Size-resolved PM: SO4, NO3, NH4, Na, Cl, H, Ca, Si, OC, EC, other elemental cations, anions, metals, at high time resolution. VOCs: (1) High time resolution on reactive O3 precursor classes. (2) SOA precursor classes speciated (detailed speciation for members of Aromatics, Alkenes, Monoterpenes, etc.). (3) Oxygenated first and second level products for the above.
Wish list for Process Studies: Three studies that would help reduce uncertainties in AQ models: • Multi-species (VOC and organic) gas deposition flux and • deposition velocities. (2) Hulis and polymer formation – lab and ambient, with New Directions instrumentation. (3) Detailed emissions speciation for the top 80% of mass of primary PM, VOC, inorganic gas emissions.
Summary: Fundamental process measurements are necessary for model construction and evaluation of components. Monitoring networks: good for forecasting/operational use and identifying broad-scale problems, but still limited in terms of time and speciation, hence limited for diagnostic evaluation. Measurement Intensives / diagnostic measurements: necessary to work perform diagnostic evaluations for control strategy runs.