Download
1 / 21
210 likes | 324 Views
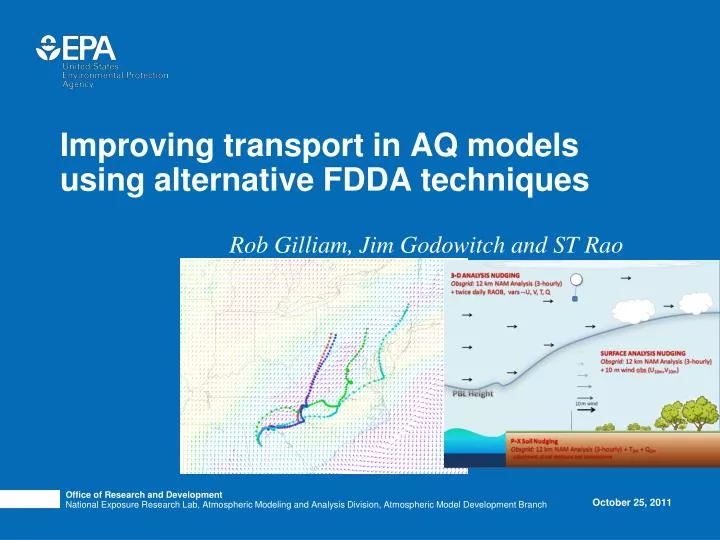
Improving transport in AQ models using alternative FDDA techniques. Rob Gilliam, Jim Godowitch and ST Rao. Office of Research and Development National Exposure Research Lab, Atmospheric Modeling and Analysis Division, Atmospheric Model Development Branch. October 25, 2011.

E N D
Improving transport in AQ models using alternative FDDA techniques Rob Gilliam, Jim Godowitch and ST Rao Office of Research and Development National Exposure Research Lab, Atmospheric Modeling and Analysis Division, Atmospheric Model Development Branch October 25, 2011
Why focus on transport? • Even a perfectly designed air quality model will produce poor solutions if meteorological transport fields have excessive uncertainty. • Nocturnal jets and residual layer winds are important features in regional pollution transport that have often been inadequately simulated in the past, thus, a main focus of this study. • An example of the impact: the ozone formed over urban areas during the day can be transported quite differently overnight depending on the meteorological transport.
Current Transport Issues in WRF Godowitch et al. (2011) Recent evaluations of modeled winds in the lower troposphere (<1000 m), have clearly shown biases in wind, which is likely injecting considerable uncertainty in CMAQ’s transport. Godowitch et al. (2011)
Can we improve these modeling problem by altering our current nudging techniques? Can new or unused observations improve WRF if used in our FDDA?
3-D ANALYSIS NUDGINGObsgrid: 12 km NAM Analysis (3-hourly) + twice daily RAOB, vars --U, V, T, Q SURFACE ANALYSIS NUDGINGObsgrid: 12 km NAM Analysis (3-hourly) + 10 m wind obs (U10m,V10m) PBL Height 10 m wind P-X Soil NudgingObsgrid: 12 km NAM Analysis (3-hourly) + T2m + Q2m- adjustment of soil moisture and temperature
Unused wind profiler observation are available that could improve FDDA UHF ProfilerPros: high vertical (10’s of m) and temporal resolution (sub-hourly), good coverage in the more critical air shedsCons: inconsistent spacing Velocity Azimuth Display (VAD)Pros: Consistent and full US spatial coverage, sub-hourly and easily accessibleCons: Coarse vertical resolution, can be influenced by birds and precip
Sensitivity Comparisons • WRF Version 3.3,12 km CONUS, 34 levels, standard US EPA model physics • 4 day case, Aug 11-14, 2002 • Six sensitivity model simulations • East US high ozone case examined by Godowitch et al. (2011) **From Stull (1988) Main metric is CHANGE in layer-average error
SENS1 vs. BASEImpact of Surface Analysis Nudging Frequency distribution of wind speed error difference at sites in spatial plots to the left
Jun-Aug 2006 Wind Speed RMSE (300-1000 m) Error difference (NewAssim-AQMEII) (300-1000 m)
Jun-Aug 2006 Wind Speed Bias (300-1000 m) Change in Bias (300-1000 m)
Jun-Aug 2006 Wind Dir. MAE (300-1000 m) NewAssim-AQMEII MAE (300-1000 m) Change in WD bias (300-1000 m)
Jun-Aug 2006Diurnal Statistics RMSE Wind SpeedBASENewAssim RMSE Wind Speed Bias Wind Speed BASENewAssim Bias Wind Speed
Conclusions • Assimilation of UHF and VAD winds above the PBL were independently shown to improve model representation of the nocturnal jet and residual layer. • Convective boundary layer winds were improved by eliminating all PBL nudging and refining the geostropic forcing at the top of the PBL using UHF and VAD observations; a top down approach. • No PBL nudging will allow PBL models to interact with the land-surface model freely without the artificial nudging.
Future Work • Investigate other sources of wind and temperature profiles - Aircraft wind, temperature and moisture profiles - Satellite wind - Satellite sounding and radiance data - mesoscale analyses • Show that improvements translate to better air quality model results • Independent verification of our approach from other groups is necessary. Feel free to contact me for detail on data preprocessing.
Nudging Sensitivities • 4 day case, Aug 11-14, 2002 • East US high ozone case examined by Godowitch et al. (2011) SANSurface analysis nudging 3D AN3D Analysis Nudging
Observations from RAOB and VAD sites that were in close proximity (39 are collocated) paired in time at the ~500, 750 and 1000 m levels • RMSE, Bias and Index of agreement (IOA) were computed to provide a level of inherent observation uncertainty Observational Uncertainty


![[Alternative Ownership Models]](https://cdn2.slideserve.com/5345939/alternative-ownership-models-dt.jpg)