Download
1 / 17
170 likes | 257 Views
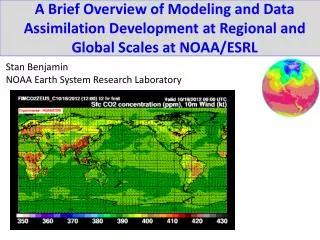
Structure and Dynamics of a Dual Bore Event during IHOP as Revealed by Remote Sensing and Numerical Simulation. Steven E. Koch NOAA Research - Forecast Systems Laboratory

E N D
Structure and Dynamics of a Dual Bore Event during IHOP as Revealed by Remote Sensing and Numerical Simulation Steven E. Koch NOAA Research - Forecast Systems Laboratory Mariusz Pagowski, James W. Wilson 1, Frederic Fabry 2, Wayne Feltz 3, Geary Schwemmer 4, Bart Geerts 5, Belay Demoz 4, Bruce Gentry 4, David Parsons 1, Tammy Weckwerth 1, Dave Whiteman4 1 National Center for Atmospheric Research 2 Radar Observatory, McGill University 3 CIMSS / University of Wisconsin 4 NASA / Goddard Space Flight Center 5 Department of Atmospheric Sciences, University of Wyoming
Data used in Study of Two Bores on June 4, 2002 • Homestead observing systems: • FM-CW radar • MAPR (Multiple Antenna Profiler) • HARLIE (aerosol backscatter lidar) • GLOW (Doppler lidar) • Scanning Raman lidar (mixing ratio) • 10-min AERI & 3-h CLASS data • S-POL reflectivity, radial velocity, computed refractivity • Mesonet time series, incl.refractivity calculations • Surface composite radar reflectivity and mesonetwork plots • UW King Air flight-level data
Relationship of Pressure to Temperature Fluctuations attending Bore Passage Warming or very slight temperature changes occur with passage of both bores
Evolution of gravity currents or bores (white lines) and synoptic cold front (blue line) as seen in Radar Composite and Mesonet Data
Bore B as seen by FM-CW and Raman Lidar UWKA Flight-Level Data Noisy data
SE NW potential temperature Bore B seen in UW King Air Data at FL 1850 m AGL • 3C cooling and 4 g/kg more moisture are found at this level behind the bore (NW). • KA penetrated solitary waves at the top of the bore. The waves are ranked in amplitude (as in FM-CW). • Vertical motions are in phase quadrature with theta and u/v, as in a typical gravity wave, but strangely out of phase with pressure fluctuations. vertical air velocity mixing ratio Wave propagation
A B AERI Detection of Bores A & B Potential Temperature Relative Humidity Mixing Ratio
Rapid decrease of refractivity in both S-POL and mesonet data due to drying caused by passage of Bore A: entrainment?
Numerical Simulations of Turbulent Kinetic Energy (TKE) Generation and Mixing by Bore • Nested MM5 model (18, 6, 2, 0.666 km) initialized at 00Z 4 June 02 • Initial / boundary conditions from RUC-20 model • 44 vertical levels (22 below 1500 m) • Three PBL experiments (all use Mellor-Yamada 2.5 closures): • BT (Burk & Thompson 1989): uses diagnostic mixing length • ETA (Janjic 1994): similar to B-T scheme but with limit upon mixing length in statically stable layers resulting in less TKE generation • QL (Kantha & Clayson 1994) offers several differences: • Improved closure for pressure covariance • Richardson number-dependent shear instability mixing term in strongly stratified layers enhances TKE in stable layer above a well-mixed PBL • Prognostic equations for TKE and for mixing length
BT 666-m simulation of TKE (shaded), 2D circulation vectors, and potential temperature 0730 – 0930 UTC: Bore B BT and ETA results both show less mixing than QL results because shorter mixing length creates more TKE dissipation
Conclusions • Two bores or solitons observed as fine lines in S-POL reflectivity and by remote sensing systems: • Bore A occurred along an outflow boundary that propagated eastward from the Oklahoma Panhandle • Bore B occurred along a cold front enhanced by postfrontal convection in northwestern Kansas • Solitary waves developed to the rear of each leading fine line atop a 700 – 1000 m deep surface stable layer. Depth of stable layer increased by 0.6 km with passage of leading wave in bores A and B. • Solitary wave characteristics: periodicity = 15 – 30 min, horizontal wavelength = 10 – 20 km, phase speed = 11.4 – 12.6 m/s. Waves exhibited amplitude-ordering (leading wave always the largest one).
Conclusions • Pronounced reduction in refractivity due to drying in surface layer occurred when the leading pressure jump was relatively strong. • Cooling & moistening aloft (seen in AERI data and UWKA data for Bore B) occurred as a likely result of adiabatic lifting. • Bore A appears to have been a soliton on a surface inversion layer. Bore B occurred at a higher elevation of 1.2 km as the inversion had lifted by that time. It appears to have been weakening. • Numerical simulations are being used to understand actual bore generation mechanism, solitary wave dynamics, and why drying (reduction of refractivity) only occurs at certain times. Bore forcing mechanisms are very sensitive to model physics, and details concerning entrainment and turbulence depend upon PBL parameterization – suggesting need for LES studies.