Download
1 / 19
190 likes | 195 Views
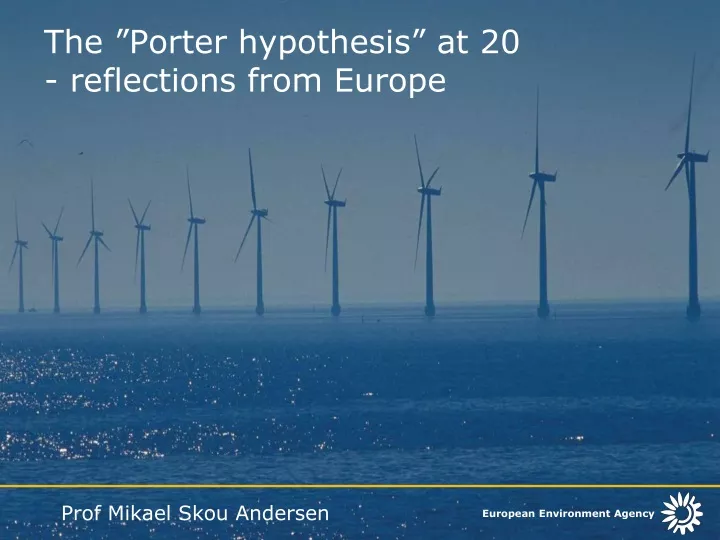
The ”Porter hypothesis” at 20 - reflections from Europe. Prof Mikael Skou Andersen. What do we understand by ”competitiveness” ?.

E N D
The ”Porter hypothesis” at 20 - reflections from Europe Prof Mikael Skou Andersen
What do we understand by ”competitiveness” ? “the degree to which a country can, under free and fair market conditions, produce goods and services which meet the test of international markets, while simultaneously maintaining and expanding the real incomes of its people over the longer term” (OECD, 1993)
New framework for industry rivalry directs attention to resource inefficiencies raises corporate awareness more certainty for green innovators overcomes inertia and fosters creativity improves learning to obtain long-term gains induces change The critics: company level gains are small and cannot offset cost increases cost-benefit analysis required to identify welfare economic advantages Porter hypothesis: environmental regulation*) promotes competitiveness • *) Scientific American, 1991: Requires incentive-based regulations
Environmental tax reform (ETR)revenue as a share of GDP (1995-2003)
Effect of ETR on total fuel demand % difference from baseline Denmark Germany Note(s) : % difference is the difference between the base case and the counterfactual reference case. Source(s) : CE.
Effect of ETR on total fuel demand % difference Denmark Germany Finland UK Note(s) : % difference is the difference between the base case and the counterfactual reference case. Source(s) : CE.
Effect of ETR on total fuel demand % difference Slovenia Denmark Germany Finland UK Note(s) : % difference is the difference between the base case and the counterfactual reference case. Source(s) : CE.
Effect of ETR on total fuel demand % difference Slovenia Denmark Germany Finland UK Sweden Note(s) : % difference is the difference between the base case and the counterfactual reference case. Source(s) : CE.
Effect of ETR on total fuel demand % difference Slovenia Denmark Germany Netherlands Finland UK Sweden Note(s) : % difference is the difference between the base case and the counterfactual reference case. Source(s) : CE.
Effect of ETR on GHG emissions % difference Slovenia Denmark Germany Netherlands UK Finland Sweden Note(s) : % difference is the difference between the base case and the counterfactual reference case. Source(s) : CE.
The Effect of ETR on Employment % difference Germany Denmark UK Sweden Note(s) : % difference is the difference between the base case and the counterfactual reference case. Source(s) : CE.
Effect of ETR on GDP % difference Netherlands Finland Germany Denmark Slovenia Sweden UK Note(s) : % difference is the difference between the base case and the counterfactual reference case. Source(s) : CE.
Without Revenue Recycling:Effect of ETR on GDP % difference Germany Finland Netherlands Sweden Denmark Note(s) : % difference is the difference between the base case and the no revenue recycling case. Source(s) : CE.
Why should we have faith in E3ME results ? • Ex-post approach • Macro-econometric model based on time-series data • Good representation of fuel carriers; high sectoral disaggregation • ETR modelled with official figures for revenues, not nominal tax rates • Technological progress indicator represents impact via improved R&D • Standard impact assessment tool for EU
Why energy taxes differ from energy prices ? • increased energy prices also have an impact on unit costs via prices on imported raw materials • from an increased energy price no revenue can be recycled to lower distortionary taxes • psychologically the signalling effect of tax is probably stronger than of price • accompanying policy measures differ
Kaldor paradox on competitiveness • Increase in technological capacity (R&D) and productivity correlate better with increased market shares than unit labour costs • If carbon-energy taxes improve R&D and productivity it may help explain how the test of international markets are met
Thanks for your attention