Download
1 / 18
200 likes | 245 Views
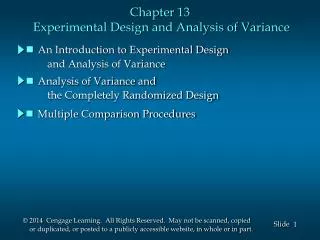
Chapter-16: Analysis of Variance and Covariance Relationship among techniques.

E N D
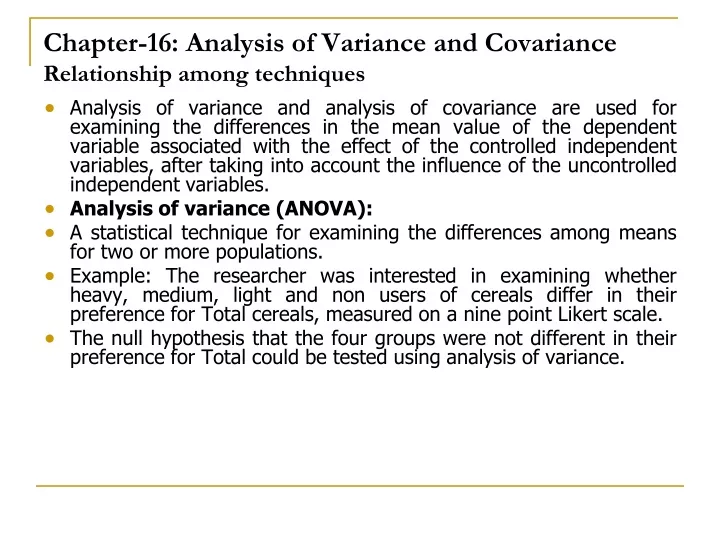
Chapter-16: Analysis of Variance and Covariance Relationship among techniques • Analysis of variance and analysis of covariance are used for examining the differences in the mean value of the dependent variable associated with the effect of the controlled independent variables, after taking into account the influence of the uncontrolled independent variables. • Analysis of variance (ANOVA): • A statistical technique for examining the differences among means for two or more populations. • Example: The researcher was interested in examining whether heavy, medium, light and non users of cereals differ in their preference for Total cereals, measured on a nine point Likert scale. • The null hypothesis that the four groups were not different in their preference for Total could be tested using analysis of variance.
Relationship Amongst Test, Analysis of Variance, Analysis of Covariance, & Regression Fig. 16.1 Metric Dependent Variable One Independent One or More Variable Independent Variables Categorical: Categorical Interval Binary Factorial and Interval Analysis of Analysis of Regression t Test Variance Covariance More than One Factor One Factor One-Way Analysis N-Way Analysis of Variance of Variance
Relationship among techniques • FACTORS: • Categorical independent variables are called factors. The independent variables must be all categorical to use ANOVA. • TREATMENT: • In ANOVA a particular combination of factor levels or categories is called treatment. • One way analysis of variance involves any one categorical variable or a single factor. • N way analysis of variance is the one which involves two or more factors. • Analysis of covariance (ANCOVA): • An advanced analysis of variance procedure in which the effects of one or more metric scaled extraneous variables are removed from dependent variable before conducting the ANOVA.
One way analysis of Variance • Marketing researchers are often interested in examining the differences in the mean values of the dependent variable for several categories of a single independent variable or factor. • Example: • Do the various segments differ in terms of their volume of product consumption? • Do the brand evaluations of groups exposed to different commercials vary? • The answer to these and similar questions can be determined by conducting one way analysis of variance.
Statistics associated with one way analysis of variance: • eta² (η²): The strength of the effects of X on Y is measured by eta² (η²). The value of eta² (η²) varies between 0 and 1. • F statistic: The null hypothesis that the category means are equal in the population is tested by an F Statistic based on the ratio of the mean square related to X and mean square related to error. • Mean Square: The mean square is the sum of squares divided by approximate degrees of freedom. • SS between: Also denoted by SSx , this is the variation in Y related to the variation in means of the categories of X. • SS within: Also referred to as SSerror, this is the variation due to the variation within each of the categories of X. • SSy: The total variation in Y is SSy.
CONDUCTING ONE WAY ANALYSIS OF VARIANCE: • Step-1: Identify the dependent and independent variables. • Step- 2: Decompose the total variation. • Step-3: Measure the effects. • Step-4: Test the significance. • Step-5: Interpret the results.
CONDUCTING ONE WAY ANALYSIS OF VARIANCE: • Identify the dependent and independent variables: The dependent variable is denoted by Y and the independent variable is denoted by X. There are n observations on Y for each category of X. • Decompose the total variation: SSy= SSx + SSerror. SSy= ∑ ( Yi -Y¯)² , Where, Yi individual observation SSx = ∑ n( Yj - Y¯)², Where, Yj each groups mean SSerror = ∑ ∑ n( Yij - Yj¯)², [ Each observation-each groups mean]
CONDUCTING ONE WAY ANALYSIS OF VARIANCE: • MEASURING THE EFFECTS: • The strength of the effects of X on Y are measured as follows: SSx ( SSy-SSerror) • η² =---------- = -------------------------- SSy SSy • The value of η² varies from 0 to1.
CONDUCTING ONE WAY ANALYSIS OF VARIANCE: • Test the significance: • Here the null hypothesis in all categories is equal. Under the null hypothesis SSx and SSerror come from the same source of variation. SSx • Sy²= ------------------------- ( c-1) SSerror • Sy²= ------------------------- (N-c) • The null hypothesis may also be tested by F statistic based on the ratio of the two estimates: SSx / (c-1) MSx • F= ----------------------------= -------------------- SSerror / (N-c) MSerror.
Assumptions in Analysis of variance: • Ordinarily the categories of the independent variables are assumed to be fixed. Interferences are only made to specific categories. This is referred to as fixed effects model. Other models are also available. Such as: random effects model, mixed effects model etc. • The error is normally distributed, with a zero mean and a constant variance. The error is not related to any of the categories of X. • The error terms are uncorrelated. If the terms are uncorrelated the F ratio can be seriously distorted.
N Way Analysis of Variance • Example: • How do customer’s intentions to buy a brand vary from different levels of price and different levels of distribution? • Do education levels and age affect consumption of a brand? • In determining such effects n way analysis of variance is used. • Interactions occur when the effects of one factor on the dependent variable depend on the level of other factors The total variation is partitioned as: • SSy= SSx1+ SSx2+ SSx1x2+ SSerror. • dfn = ( C1-1) +( C2-1) + ( C1-1) ( C2-1) • dfd = N-C1C2
N Way Analysis of Variance • The strength of the joining effect of two factors called multiple η² is measured as follows: (SSx1+ SSx2+ SSx1x2) • Multiple η² = ----------------------------------- SSy • The significance of the overall effect may be tested by a F-test. (SSx1+ SSx2+ SSx1x2)/dfn • F=------------------------------------------ SSerror/ dfd • If the overall effect is significant the next step is to examine the significance of the interaction effect:
N Way Analysis of Variance SS x1 x2 / dfn • F= ----------------------------- SSerror/ dfn MSx1x2 = ------------------------ MSerror • The significance of the main effect of each factor may be tested as follows: SSx1/ dfn • F = ------------------------------ SSerror/ dfn MSx1 = ----------------- MSerror
Analysis of Covariance • Example: • In determining how customers’ interaction to buy a brand vary with different levels of price, attitude toward the brand may have top be taken into consideration • In such cases analysis of covariance is used • INTERACTIONS: • Ordinal interaction: An interaction where the rank order of the effects attributable to one factor does not chance across the levels of the second factor. • Disordinal interaction: The change in rank order of the effects of one factor across the levels of the other
Relative importance of factors: SSx- (dfx X MSerror) • Omega² ( ω² ) = ----------------------------------- SStotal + Ms error • It is a measure indicating the portion of the variation in the dependent variable explained by a particular independent variable or factor.
MULTIPLE COMPARISONS: • Contrasts: In ANOVA, a method of examining differences among two or more means of the treatment groups. • A priori contrasts: Contrasts that are determined before conducting the analysis based on the researchers theoretical framework. • A posteriori contrasts: Contrasts made after the hypothesis. They are generally multiple comparison tests. • Multiple comparison tests: A posteriori contrasts that enable the researcher to construct generalized confidence intervals that can be used to make pairwise comparisons of all treatment means.
REPEATED MEASURES ANOVA: • An ANOVA technique used when respondents are exposed to more then one treatment condition and repeated measurements as obtained. Here, • SStotal= SSbetween people+ SS within people • SSwithin people= SSx + SSerror. NON METRIC ANALYSIS OF VARIANCE: • Non- metric ANOVA: An ANOVA technique for examining the difference in the central tendencies for more than two groups when the dependent variable is measured on an ordinal scale. • k- sample median test: Non parametric test that is used to examine differences among groups when the dependent variable is measured on ordinal scale. • Kruskal Wallis one way analysis of variance: A non metric ANOVA test that uses the rank value of each case not merely its location relative to the median.
MULTIVARIATE ANALYSIS OF VARIANCE • An ANOVA technique using two or more metric dependent variables. • In MANOVA the null hypothesis is that the vectors of all means on multiple dependent variables are equal across groups. SPSS • Analyze>Compare Means>One-Way ANOVA … • Analyze>General Linear Model>Univariate