Download
1 / 18
180 likes | 322 Views
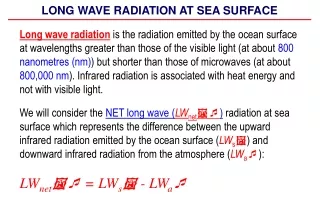
NPP CrIS Long Wave FOV1 Spectral Noise Anomaly. Xin Jin NOAA/STAR ICVS & CrIS Cal/Val Team. LW calibration targets show spectral instability in the past three months (July ~ Sept. 2013). Only LW FOV1 has such an anomaly; all other bands/FOVs are good.

E N D
NPP CrIS Long Wave FOV1 Spectral Noise Anomaly Xin Jin NOAA/STAR ICVS & CrIS Cal/Val Team
LW calibration targets show spectral instability in the past three months (July ~ Sept. 2013) • Only LW FOV1 has such an anomaly; all other bands/FOVs are good
This anomaly started at around 15:54 UTC, 2013-07-27 Zoom in
LW FOV1 NEDN between 09-12 and 09-18, 2013 Solid line: Spectral NEDN; Dash line: Specification; Plotted every 800 seconds Switch to full screen to see the animation Zoom in
LW DOV1 NEDN: historical recordbetween 2012-04-12 and 2013-10-03
LW DOV1 NEDN: last three monthsbetween 2012-07-05 and 2013-10-03
Conclusions and suggestions • Conclusions • NPP CrIS LW FOV1 has increased noised on all frequencies since 2013-07-27 15:54 UTC. • The low frequency part (wave umber< 900 cm-1) is impacted more severely than the high frequency part. In many case, the noise is higher than the specification. • This anomaly shows two peak events: one is between Sep-01 and Sep-06; another is between Sep-12 and Sep-18. • The LW FOV1 tends to be quite again since the later September. • Suggestions • Icing on the sensor might be the cause • Keep watching the trend for more time • Compare with other hyper-spectral instruments (IASI, AIRS) to check the spectral response during the anomaly
Backup slides • Spectral stability of all LW FOVs