Download
1 / 14
140 likes | 293 Views
ACRIM Composite Total Solar Irradiance Time Series. ACRIM INSTRUMENT TEAM Roger S. Helizon, Jet Propulsion Laboratory Instrument Scientist/Project Mgr. roger@simdac.jpl.nasa.gov. ACRIM SCIENCE TEAM Dr. Richard C. Willson, Columbia University Principal Investigator acrim@acrim.com

E N D
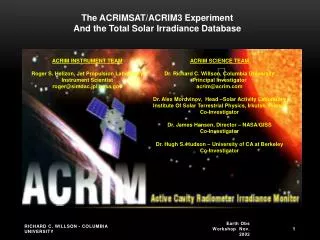
ACRIM Composite Total Solar Irradiance Time Series ACRIM INSTRUMENT TEAM Roger S. Helizon, Jet Propulsion Laboratory Instrument Scientist/Project Mgr. roger@simdac.jpl.nasa.gov ACRIM SCIENCE TEAM Dr. Richard C. Willson, Columbia University Principal Investigator acrim@acrim.com Dr. Alex Mordvinov, Head –Solar Activity Laboratory Institute Of Solar Terrestrial Physics, Irkutsk, Russia Co-Investigator Dr. James Hansen, Director – NASA/GISS Co-Investigator Dr. Hugh S. Hudson – University of CA at Berkeley Co-Investigator R C Willson - Columbia University
The Total Solar Irradiance Observational Database • Continuous monitoring since 1978 by redundant, overlapping, satellite experiments • Overlapping comparisons provide contiguous results at mutual precision levels • Absolute uncertainty varies by experiment but is not demonstrably less than 0.1 % (SI) • Traceability varies between experiments: ≥ 50 ppm/decade • Scale differences of ± 0.4 % likely due to systematic errors in sensor metrology R C Willson - Columbia University
0.4 % R C Willson - Columbia University
ACRIM ‘gap’ R C Willson - Columbia University
ACRIM Composite TSI Approach • Uses Original published results from TSI experiments Overlapping comparisons to relate experiments at mutual precision level Comparisons of ACRIM with Nimbus7/ERB to bridge the ACRIM ‘gap’ • Reconciles Composite time series to ACRIM3 ‘native scale’ R C Willson - Columbia University
Comparison of ACRIM and PMOD Composite TSI R C Willson - Columbia University
Composite TSI Measurements and Models • ACRIM Composite TSI Uses original published results from TSI experiments Uses Nimbus7/ERB ACRIM ‘gap’ ratio to link ACRIM1 and ACRIM2 • PMOD Composite TSI Modifies published results from TSI experiments Uses ERBS ACRIM ‘gap’ ratio to link ACRIM1 and ACRIM2 R C Willson - Columbia University
The ACRIM - PMOD Composite Trend Differenceis an artifact of using the Nimbus7/ERB or ERBS ACRIM ‘gap’ ratios R C Willson - Columbia University
Comparison of Nimbus7/ERB and ERBS results(Simultaneous Daily Means) ACRIM GAP R C Willson - Columbia University
Comparison of Overlapping Observationsduring ACRIM1, ACRIM ‘gap’ and ACRIM2 Periods R C Willson - Columbia University
Composite TSI Summary and Conclusions • ERBS degradation during ACRIM ‘gap’ equals the ACRIM - PMOD trend difference • PMOD adjustment of Nimbus7/ERB results during ACRIM ‘gap’ equals the ACRIM - PMOD trend difference • The absence of a minimum-to-minimum trend in composite models using ERBS results to bridge the ACRIM ‘gap’ is an artifact of ERBS degradation • Composite TSI time series using best extant data exhibit a minimum-to-minimum trend of + 0.04 %/decade during solar cycles 21 - 23 R C Willson - Columbia University