Download
1 / 30
300 likes | 428 Views
CSIM3 – The Model Explained. Vinod Bhatia Operations Director vinod.bhatia@paragonsimulation.com. Introduction. This document is technical model overview of CSIM3 model version 3-6-0 Detailed information is provided in the associated Function Specification version 3-6-0

E N D
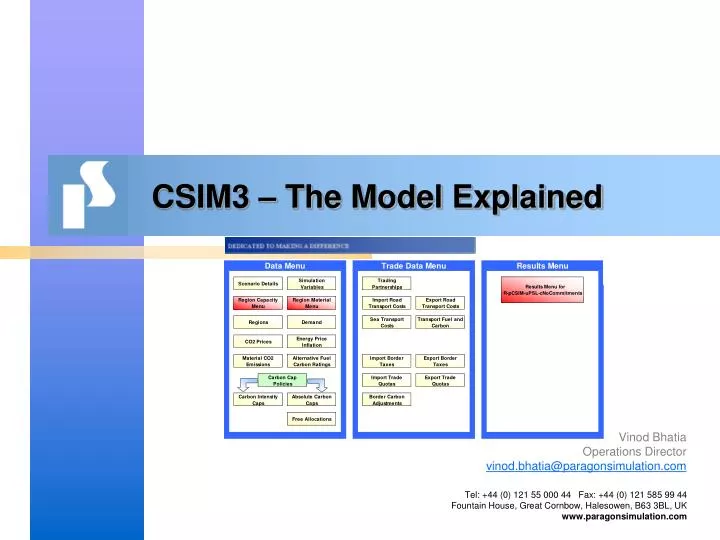
CSIM3 – The Model Explained Vinod Bhatia Operations Director vinod.bhatia@paragonsimulation.com
Introduction • This document is technical model overview of CSIM3 model version 3-6-0 • Detailed information is provided in the associated Function Specification version 3-6-0 • All data provided in this document is illustrative • All data provided in the associated model files are examples of the scenarios examined by WBCSD-CSI
Overview • Technical Framework • The Data Manager • The Cement Production Cost • The Trading Position • Model Files Supplied • Scenarios Supplied • Model Quick Start
Technical Framework When the Data Manager is opened, it installs the model engine and a toolbar, which has a button for running the model All data used by the model is held in the Data Manager. Change the data as needed. When the simulation has completed, the model takes the results and saves them in an Excel file, using the Scenario ID as the name of the file. It is important that the Scenario ID is a unique for different data sets. The format of the results is defined by a Results Manager template.
The Data Manager Yellow buttons contain data that is used by the model Red buttons take you to another menu Each one of the buttons takes you to a separate area of the Data Manager Green buttons take you to other useful sheets
Model Flow Diagram This diagram shows the logical flow of information and the classification of the different data types.
Regions The first thing to do is to define the Regions and some basic information Up to 20 regions can be set up – to date we have used eight User-definable data when yellow Not used by model when grey
Cement Demand If there is insufficient capacity, it can either build new capacity or import cement It does this by looking at each Region’s clinker-making capacity which is defined elsewhere The model’s first task is to try and meet cement demand from domestic clinker capacity Not changeable by user when green A decision to import is based on the economics of trade vs. domestic production
Regional Capacity To do this the model needs to how much it will cost to make clinker from its own facilities There is a lot of capacity information, so each Region has it’s own page
Every Region always has the ability to add New Dry capacity – so the user can’t de-select Capacity – Kiln Types & Options A lot of options can be specified for each Region, and options can be added and removed as needed The tables are quite large so they have been split up in the presentation Here we have specified that this Region has existing dry and wet kilns, and three abatement options
Capacity & Availability (in t clinker) We can specify the actual capacity, availability, remaining life and whether there is planned retirement
Non-Energy & Material Costs Investment costs are based on a cost per tonne of clinker, annualised by discounting at a specific rate over its economic lifetime. Interest Rate and Period is specified at Regional level. Here we can specify the investment costs and general production costs – note that materials and fuel costs are done separately
Electricity & Fuel The Fuel requirement is entered for each option Fuel is expressed in two parts: GJ / t clinker; and % Mix. For Existing Kilns which have not been abated, this Mix doesn’t change
Raw Materials & Blending Raw Materials is also expressed in two parts: t material / t clinker; and % Mix Blended Materials are expressed as a % of Cement, excluding Gypsum – the Gypsum % is set elsewhere
Once the data has been set up you can get the system to draw an S-Curve of the parameters that you have entered for an option – this curve is for Energy Efficiency Abatement - Penetration For Abatement options you can control what type of kiln it is applied to (Dry, Wet, Shaft, All) …and whether it can be applied to Existing, New or All capacity Abatement options can be specified in a lot of detail. In this section on the Capacity sheets, you can define when an abatement starts, how fast it penetrates, and what the maximum ‘share of parc’ is.
Abatement - Impact Fuel consumption goes down in this case Fuel consumption goes up in this case …but electricity goes down …and CO2 is stored rather than emitted Finally, for each abatement option you can specify what it does to Fuel & Electricity Consumption, and for CCS what the Carbon Storage Rate is
Regional Materials Each Region has it’s own page for materials availability and price
Fuel & Materials Availability Materials availability can change year-by-year You can set a material to “Unlimited Availability” by entering -1
Fuel & Materials Costs Materials costs can change year-by-year
Fuel & Materials CO2 Emissions For each Region, the CO2 emissions can be set up for each material
The model so far… We have defined • All the capacity details for each Region • The Electricity, Fuel and Raw Materials requirements • The investment, fixed , and variable costs • The abatement options • The CO2 emissions from domestic production We can therefore calculate • The costs of making cement from existing facilities • The costs of introducing new capacity • The costs and benefits of the abatement options
The Cement Production Cost For each Region, the model works out how much existing clinker capacity it needs to use to meet the demand for cement. If there is insufficient capacity, it will nominally “build” new capacity until the demand is met. Using the information on costs, the Cement Production Cost (CPC) can be calculated for each facility Capacity Region A The facilities are stacked in increasing cost order Demand Cement Price The most expensive facilities set the starting cement price for trading Increasing cost • For each Region, the model considers, one tranche at a time (e.g. 1Mt) • How much will it cost to make one extra tranche of cement? • How much will it save to reduce production by one tranche? The model has now calculated the marginal cost of production / non-production, and this provides the information needed to consider whether to make this tranche, or to buy it
Trade Price B Trade Quantity The Trading Position An import curve (blue) and export curve (red) can be developed from the cost information Price $/t Each import curve is unique for each region, and each export curve is unique for each trading relationship. The import curve is the importers cement price plus gross margin; the export curve is the exporters cement price plus transport costs C D A Every Region can trade with “A”. The black line represents the final trade line for importer “A”, trading with exporters “B”, “C”, and “D” for different tranches. Potential Trade Quantity (t) 0 trade When there is no more profit to be made by an exporter, trading ceases
Trade Price Trade Quantity The Trading Position The exporter decides who it will trade with based on maximising profit Each time a trade occurs, the trading positions have to be re-evaluated Price B Exports D Exports Profit from A A B Exports C Exports 1 2 3 etc Tranche
The Trade Position: World Trade There are multiple trading curves – one for each Region Each import curve (blue) is specific to the region, as the costs and gross margin are specific Each export curve (red) is specific to the trading partnership, because the costs are modified to take account of Land and Sea Transport costs which are specific to the trading partnership
Profit What about the other data? All the other data in the model is used to modify either: • The Cement Production Cost, or • The Trading Position This effects • World Trade • Emissions Carbon Cap Policies CO2 Prices Energy Price Inflation Trading Partnerships Border Taxes Trade Quotas Border Carbon Adjustments Transport Costs
Model Files Supplied Model folder, e.g. “C:\CSIM3-6-0” • A Data Manager for each of five scenarios. There are named ERM-CSI_CSIM_xxx_3-6-0.xls, where xxx is a scenario descriptor. Typically, you should only have one file open at a time • A Model Engine file ERM-CSI_CSIM_ModelEngine_3-6-0.xla which cannot be edited • A Configuration file config.xmlwhich should not be edited Results Template sub-folder e.g. “C:\CSIM3-6-0\Results Template” • A Results Manager Template ERM-CSI_CSIM_ResultsTemplate_3-6-0.xls which should not be edited
Scenarios Supplied • ERM-CSI_CSIM_DATA_NoCommitmentsBaseline_3-6-0.xls • ERM-CSI_CSIM_DATA_EUCapsOnly_3-6-0.xls • ERM-CSI_CSIM_DATA_Annex1Caps_3-6-0.xls • ERM-CSI_CSIM_DATA_SectoralApproach_3-6-0.xls • ERM-CSI_CSIM_DATA_GlobalCaps_3-6-0.xls All these files are protected
Quick Start • Open one of the Data Manager files supplied. This will attach the Model Engine and enable the CSIM3 toolbar • Change the data as required. Remember to change the name of the “Scenario ID” in the “Scenario Details” sheet – the Scenario ID is used as the name of the Results Manager file created • Save the Data Manager using a unique file name; you can follow the file naming approach suggested or develop your own • Run the model • Examine the results in the Results Manager file